Sound Devices USBPre 1.5

The first measurement rig I ever saw was based on a Sound Devices USBPre 1.5 audio i/o, Smaart 4.5 & a Josephson mic. This would of been back around 2000.

I was curious as to whether a Sound Devices USBPre 1.5 could be used with modern equipment and the answer is no. The USBPre 1.5 works with specific 32bit OS versions and will not function with a 64bit OS (all the current ones). So if you are using an older laptop that is running XP (32 bit version) or OSX 6 (or earlier), you may be able to take advantage of a USBPre 1.5 on your measurement rig.

sounddevices.com – USBPre 1.5 User Guide PDF

Here is a thread on the Rational Acoustics forum about getting a USBPre 1.5 to work with Smaart:

Rational Acoustics forum – USBPre 1.5 & Windows

Sound Devices USBPre 2

The Sound Devices USBPre2 could be considered an industry standard audio interface for 2 channel measurement purposes. I own so many audio interfaces already that I haven’t really given the USBPre2 a second thought but I’ve recently seen a need for a smaller 2 channel audio i/o that is buss powered and USB based.

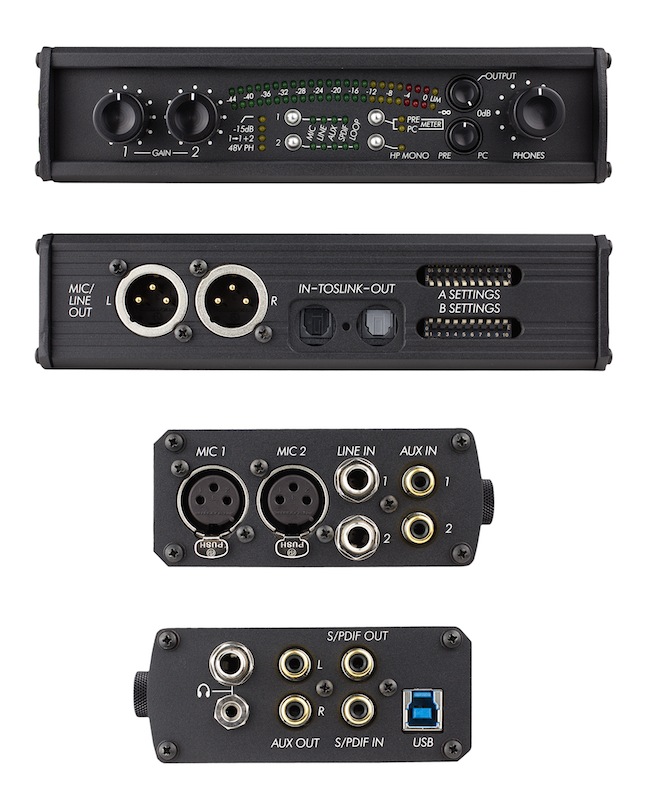
Sound Devices USBPre2 panels

sounddevices.com – USBPre2 Fact Sheet PDF

sounddevices.com – USBPre2 User Guide PDF

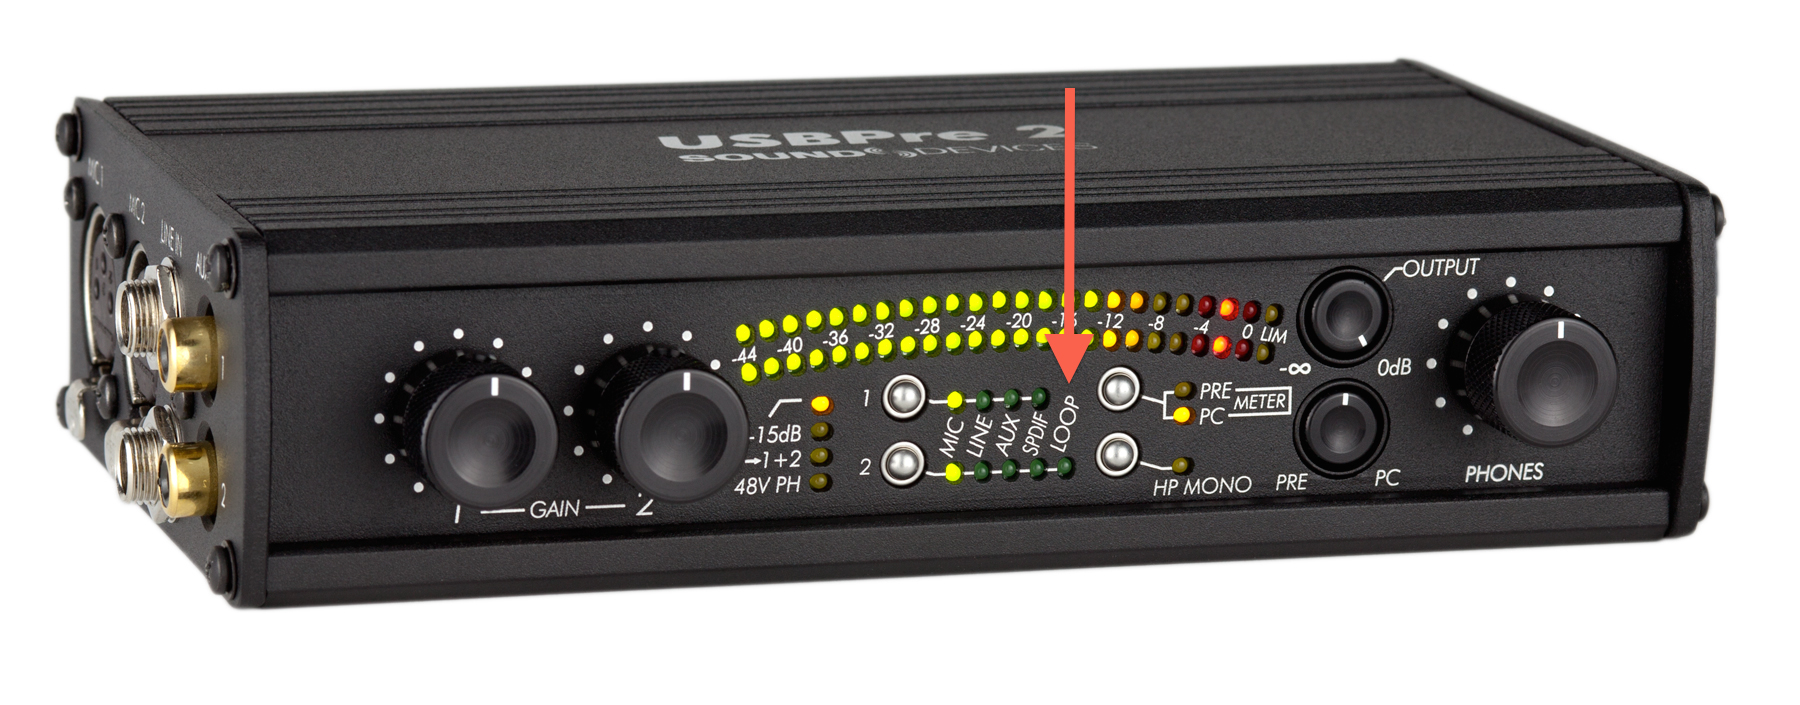
Of special interest for measurement purposes is the units internal loop through feature. This is a quote from the user guide (PDF page 20).

Sound Devices USBPre2 loop function

“Input 2 Loop Source – Input 2 has an additional source labeled LOOP. This input source does not correspond to any physical connections on the USBPre 2. When LOOP is selected, input 2’s source is derived from the left channel of the computer audio signal (post digital-to-analog conversion). The input 2 Gain Control
affects signal The Output Gain Control does not affect the level of the signal going in to input 2.The LOOP source is useful for test and measurement applications where a reference signal is required to be routed back to an input.”

What this means is that instead of needing a cable to jump from an output back into an input to provide a reference signal that follows the same circuitry and has the same latency as the measurement, select the loop through and no cable is necessary. Many times I have to go hunt for a TRS to TRS cable for this purpose so having an audio i/o with an internal loop through removes one more external element which is always a good thing when seconds count.

Audix TR40 / TR40a comparison

Over the last few years, I’ve acquired (3) Audix TR40 mics and most recently an Audix TR40a (newer model) for use when my Earthworks mics might be damaged or stolen. I was curious to see what differences there are between the two models (if any).

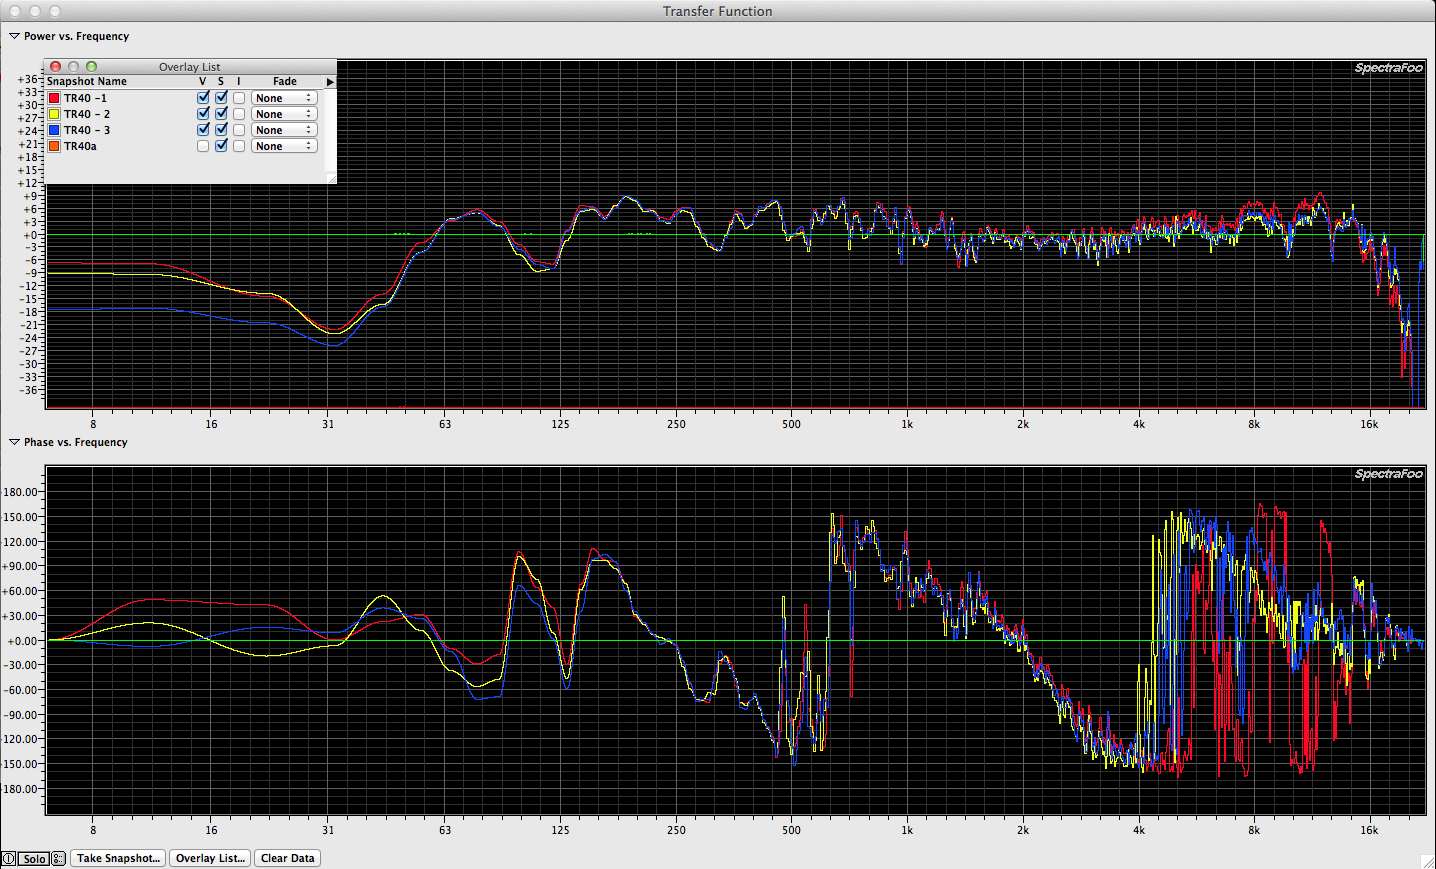
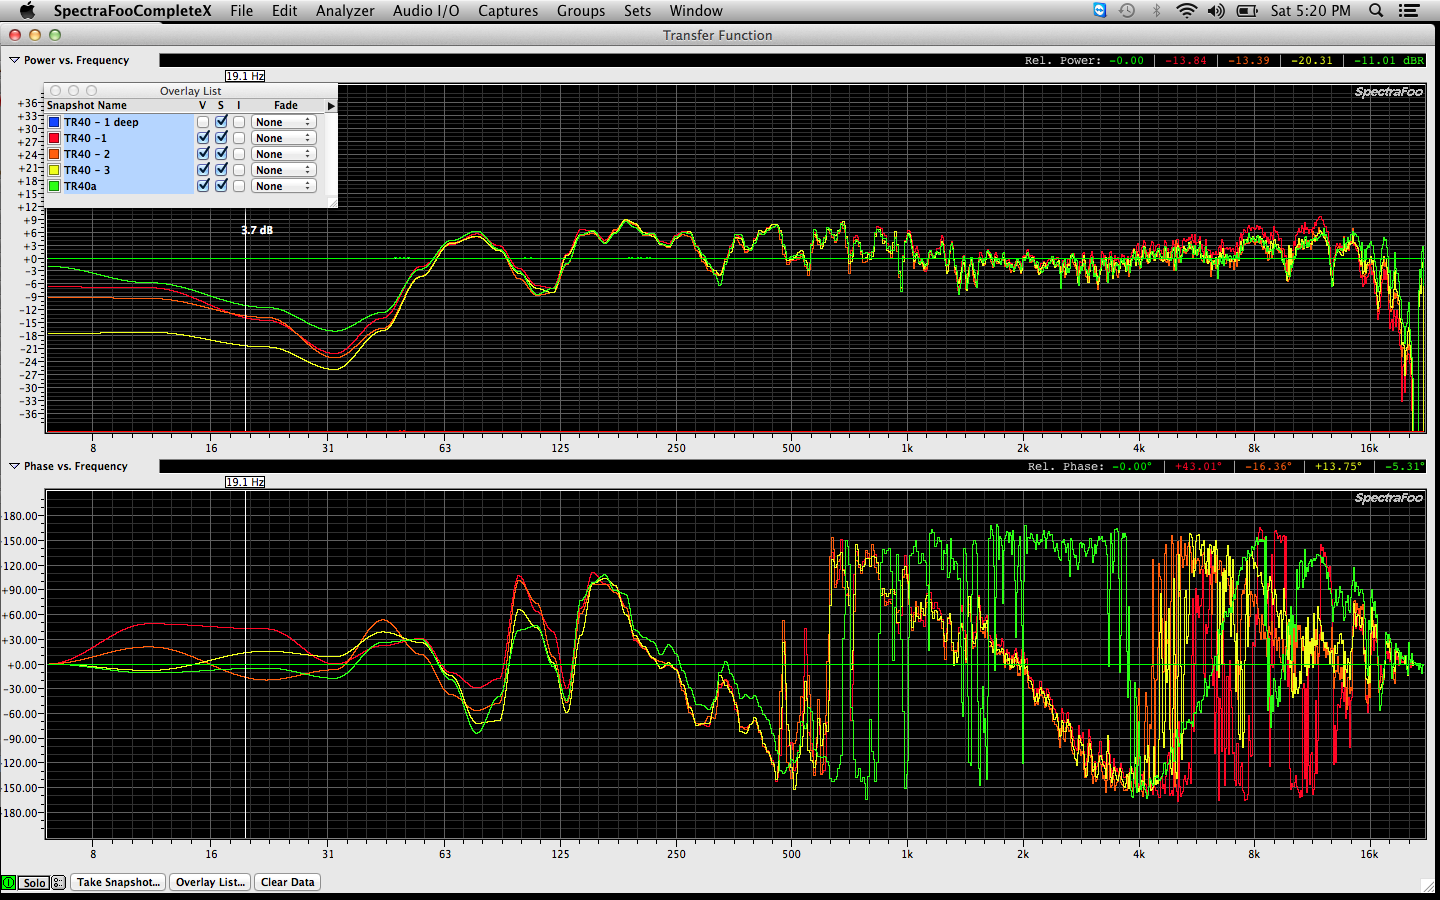
Using a QSC KW122 speaker on a stand for my DUT, I tested each mic in the same position, one at a time. What you will notice is that TR40-1,2,3 are very close in frequency response and phase response.

Here is a trace of the (3) TR40 mics.

Audix TR40 (3) mic comparison

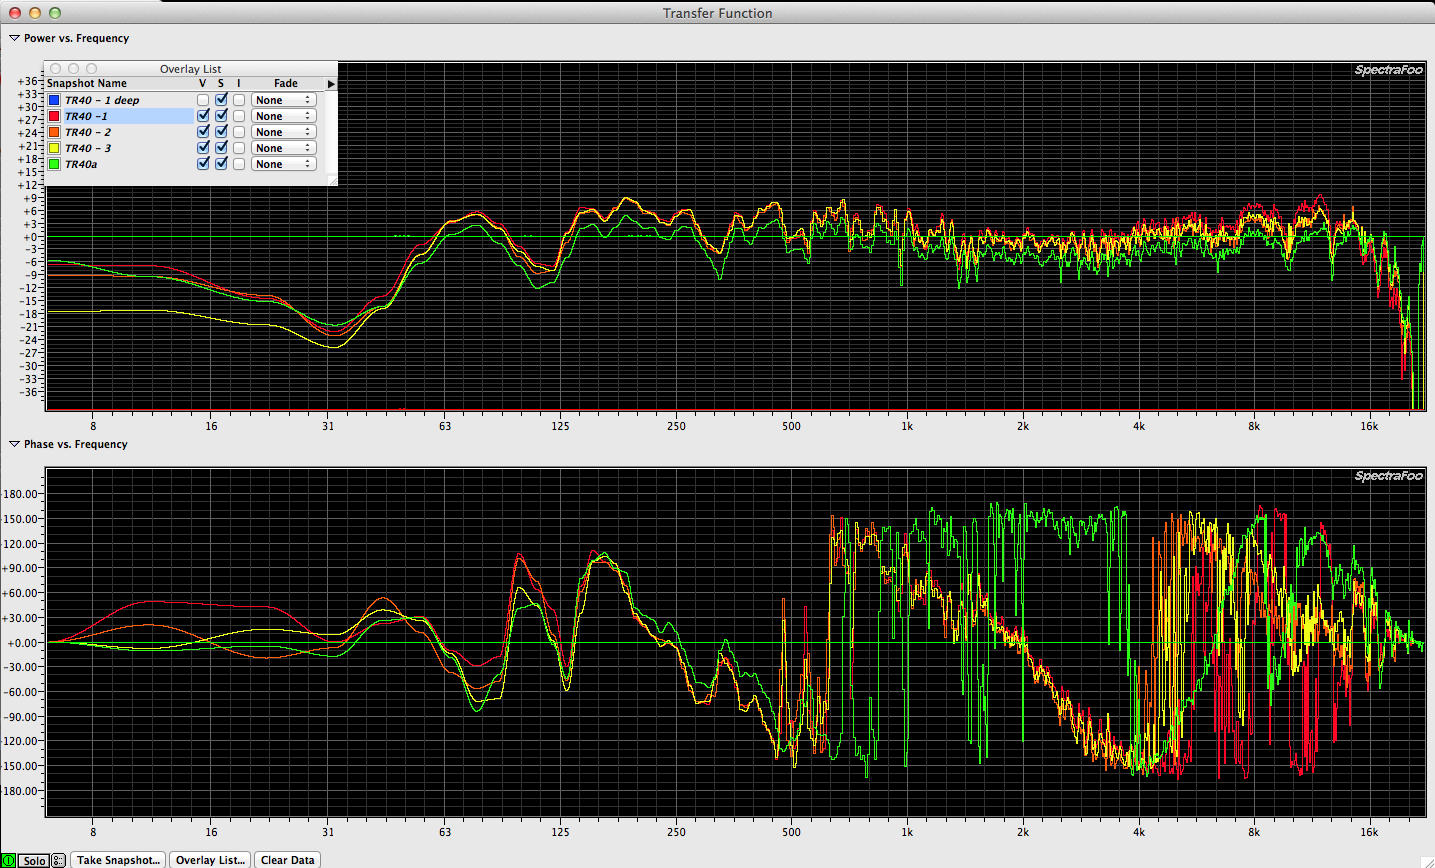
Here there TR40a is added to the overlay list.

Audix TR40 & TR40a comparison

You will note that the TR40a is roughly 3.5db less sensitive than the TR40s. The amount it takes to match the mics. Of special interest is the discrepancy in phase between all 3 TR40 compared with the TR40a.

Audix TR40 & TR40a with offset

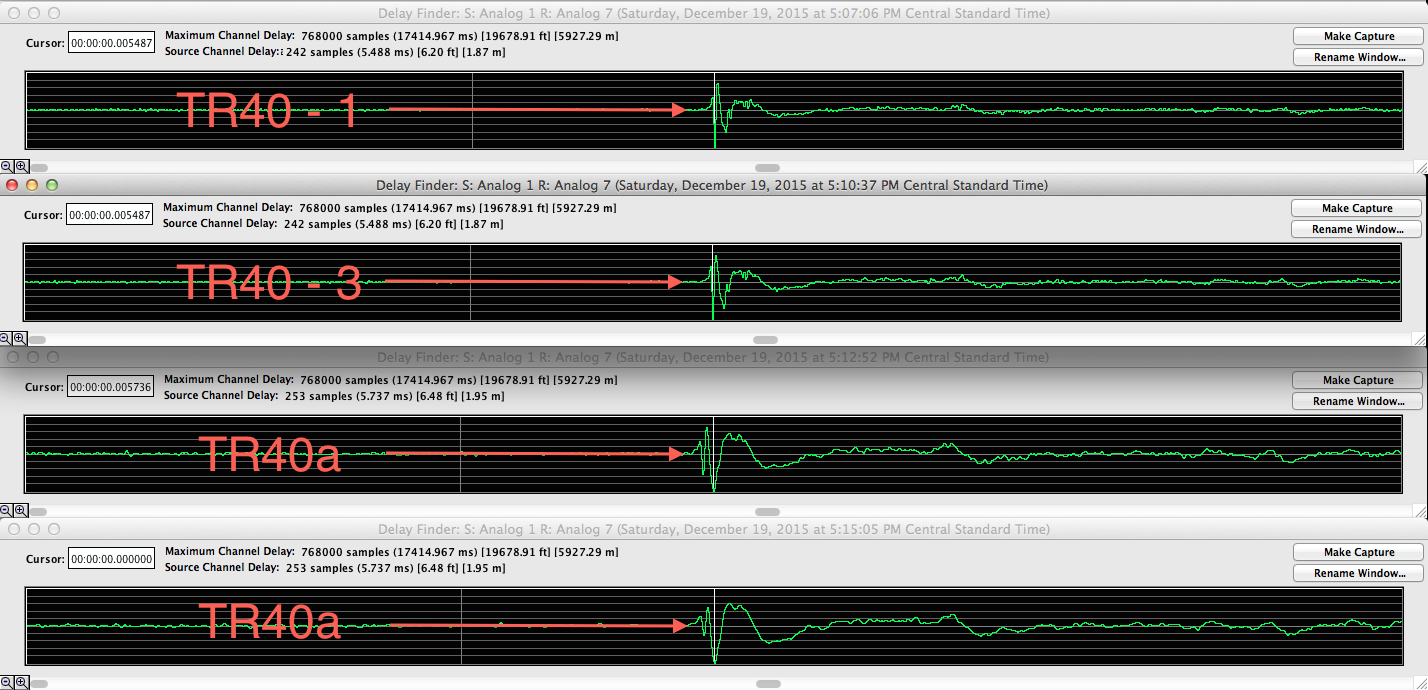
Looking at the impulse response between two of the TR40 and the TR40a, they are very different even though the measurement rig is the same. Same speaker, same position, same mic position (+/- 1/4″), same everything. Someone who knows microphone design might immediately know why the TR40a has a phase response that is so different from the other mics.

Audix TR40 & TR40a IR with text

Here is the information I can find on the specs of the TR40 and TR40a.

QSC Ksub versus QSC KW181

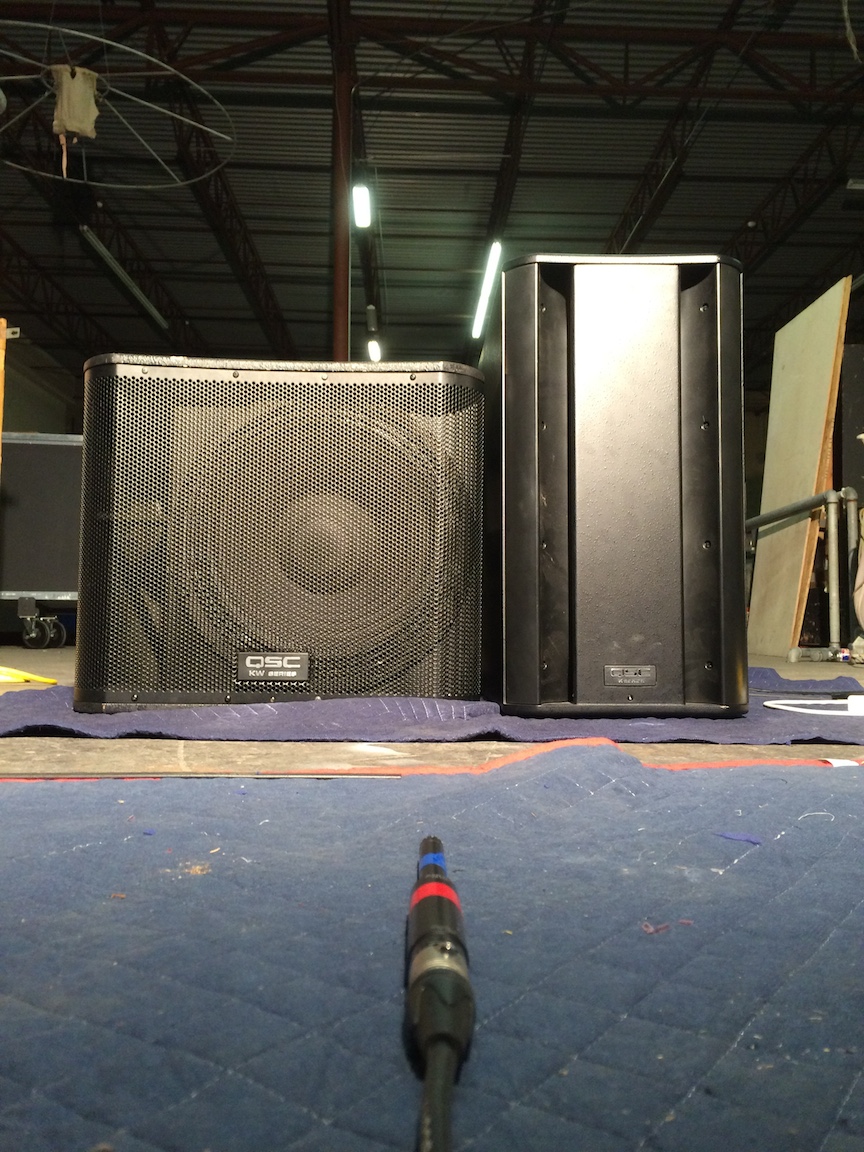
I recently found out that a fellow sound engineer has a pair of QSC Ksub (dual 12″ band pass) subs. Owning a pair of QSC KW181 subs myself, I thought I would compare and measure the two boxes.
QSC KSub KW181 comparison
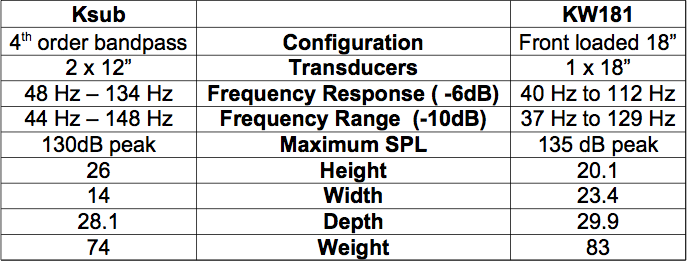
This is a spec sheet comparison of the relevant points.
QSC KSub KW181 spec comparison
QSC – KSub specs
QSC – KW181 specs
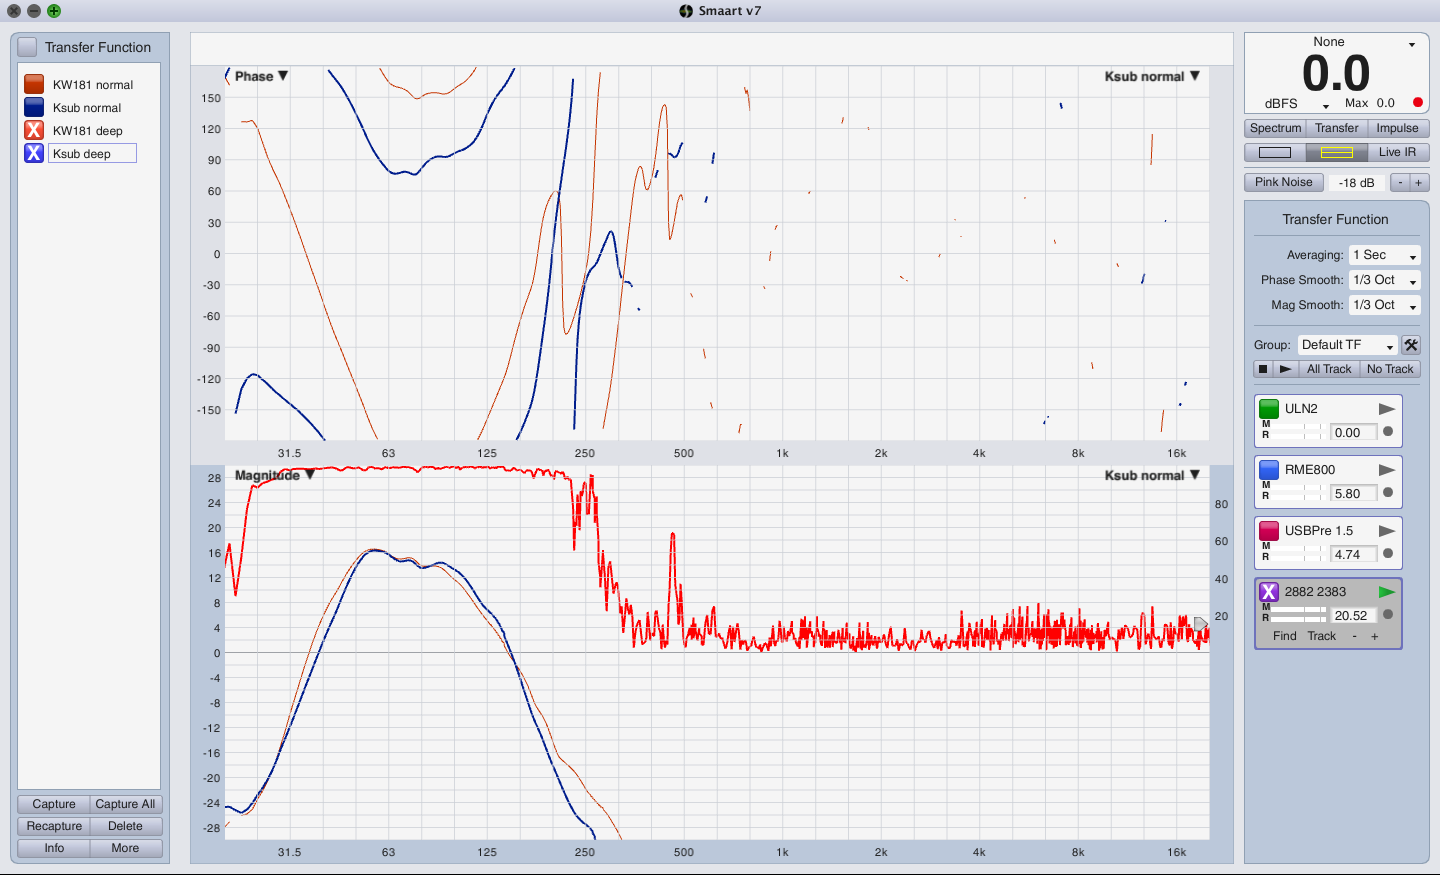
This trace is of both subs with the input level set to unity, positive polarity and contour switch set to normal.
QSC KW181 KSub comparison normal
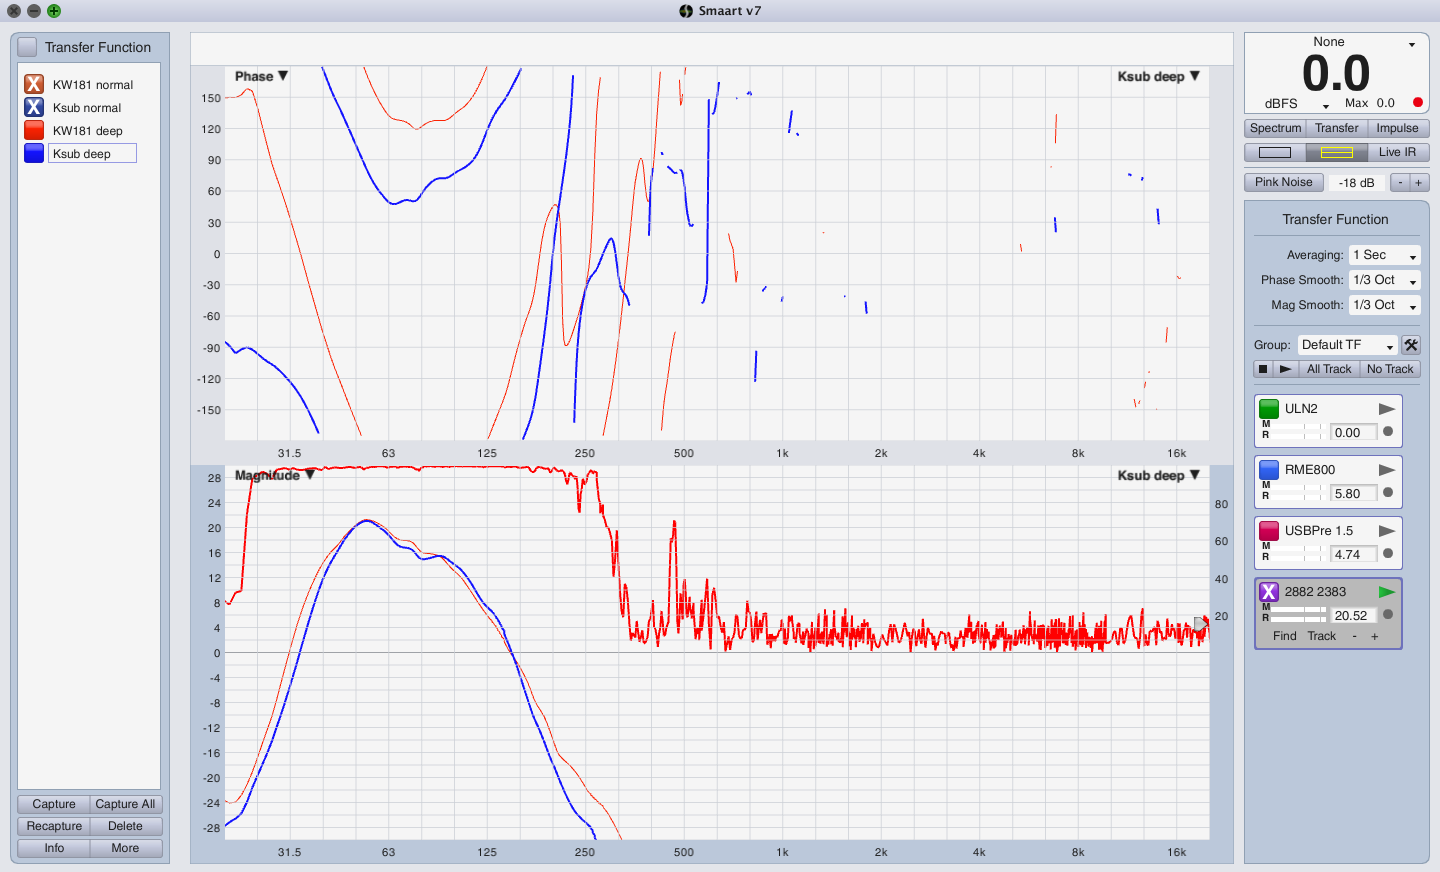
This trace is of both subs with the input level set to unity, positive polarity and contour switch set to deep.QSC KW181 KSub comparison deep
The smaller KSub (2×12″ bandpass) and KW181 (1×18″ front loaded) are for all intent and purpose, matched! I’m not sure if that speaks well of the KSub or poorly of the KW181. The KW181 does play a bit lower but the difference is small. Judging by the manufacturer specs the KW181 should be able to play 5dB louder than the Ksub but I’m unwilling to verifying that claim due to the sacrificial nature of the experiment.

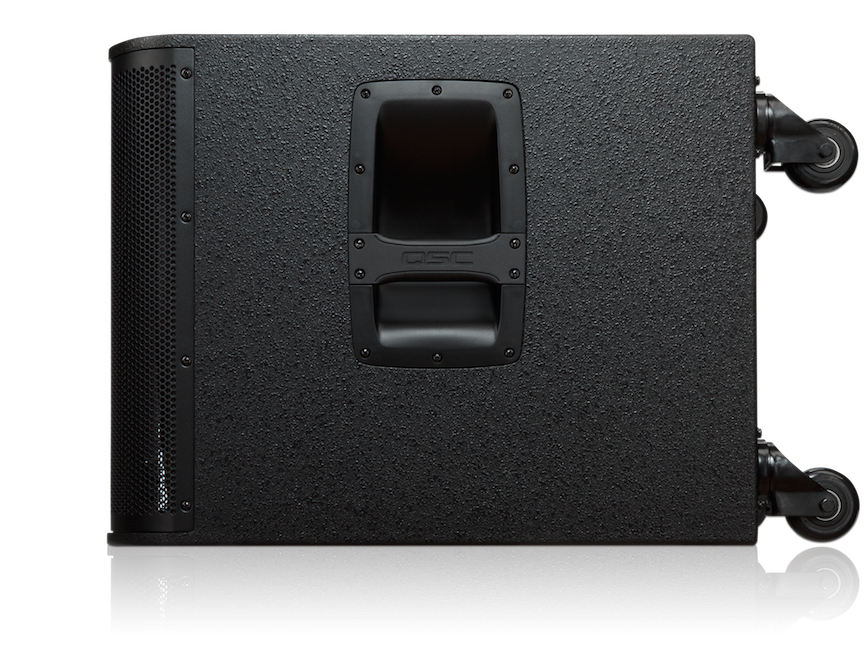
QSC KW181 subs

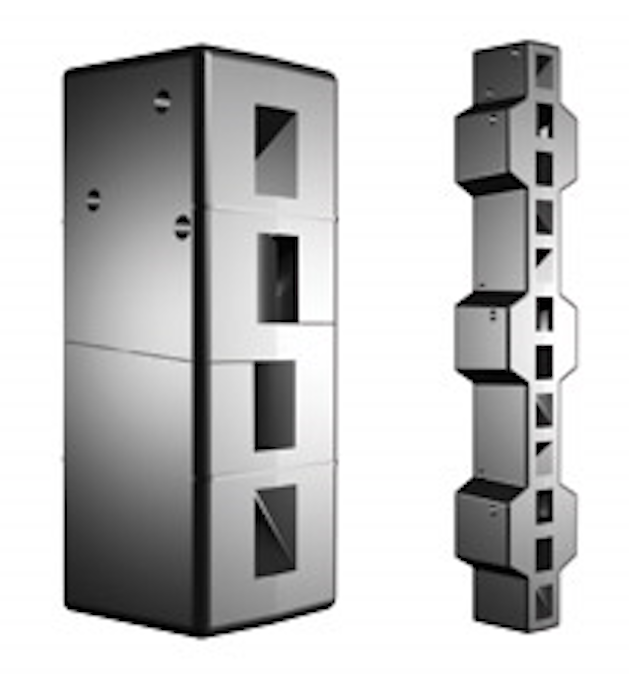
I just finished a fashion show where I used (4) QSC KW181 single 18″ subs in addition to the venue’s Meyer Sound 700HP dual stacks for low end. During the setup it was discovered that one of the Kw181 cabinets has an issue. Today while I had a few spare minutes, I measured the (3) functional cabinets to verify they match and also as a baseline for verifying the malfunctioning cabinet after it is repaired.

q_spk_kw_181_img_rearlg
q_spk_kw_181_img_frontlg2
q_spk_kw_181_img_lftprofile
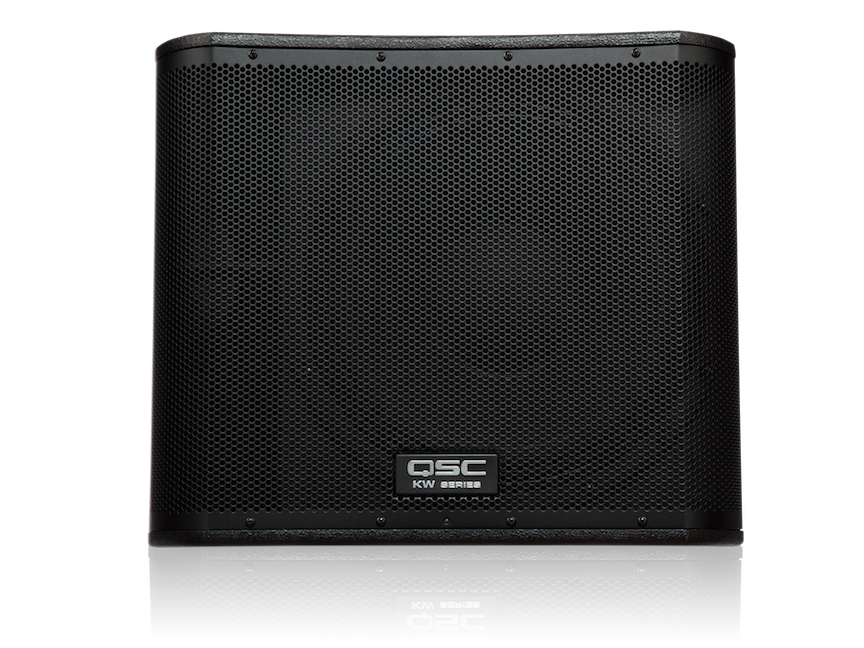
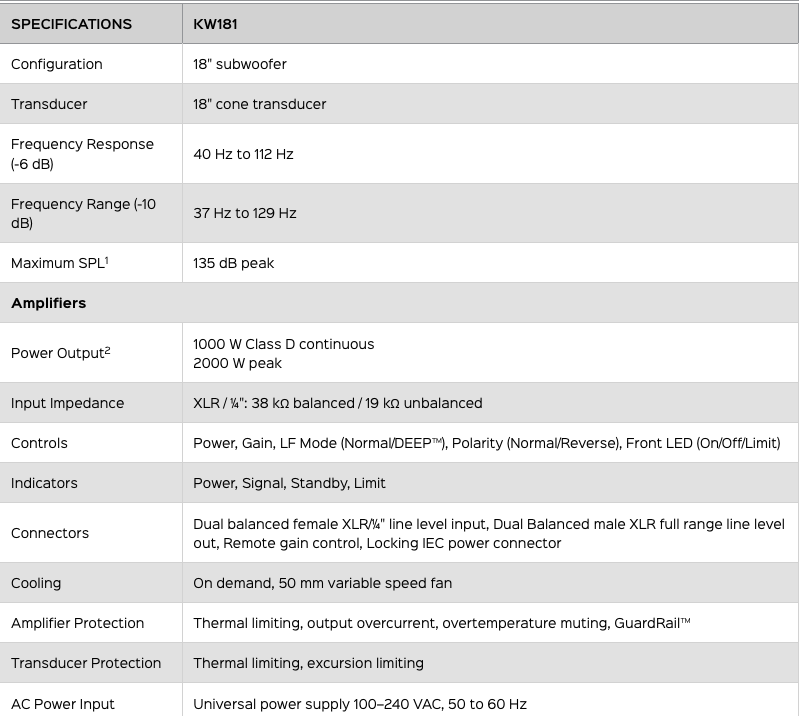
QSC KW181 specs
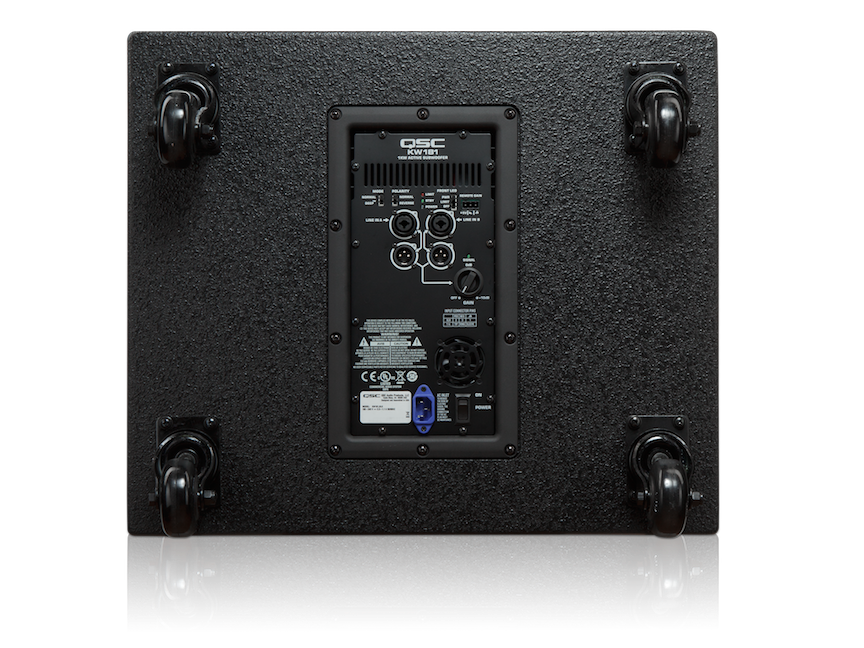
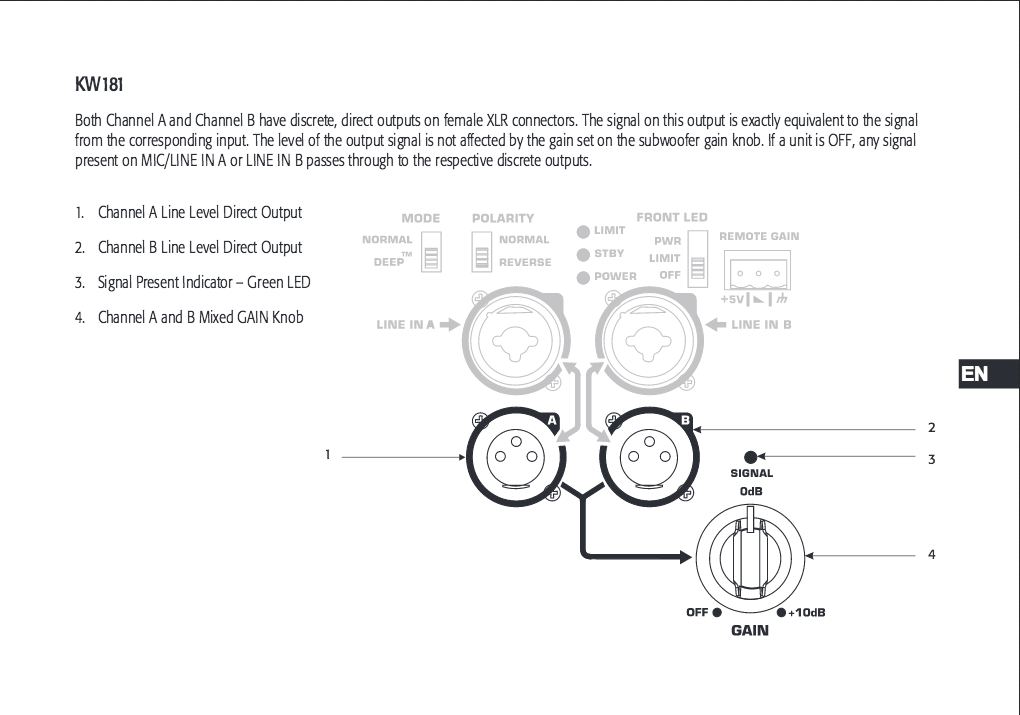
QSC KW181 rear panel

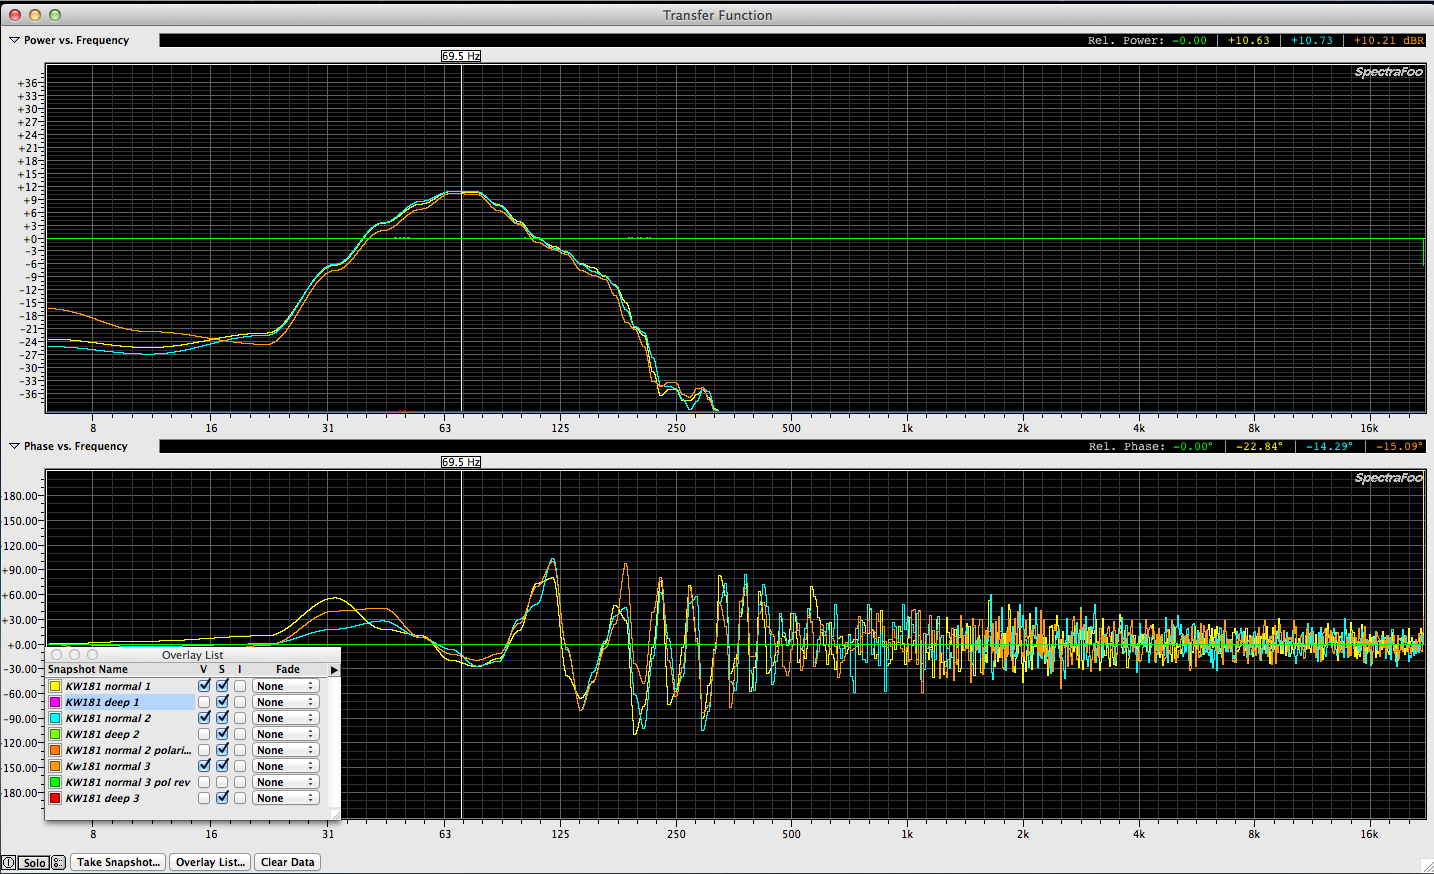
Here are (3) overlapping traces with the mode switch on NORMAL.
QSC KW181 3 normal

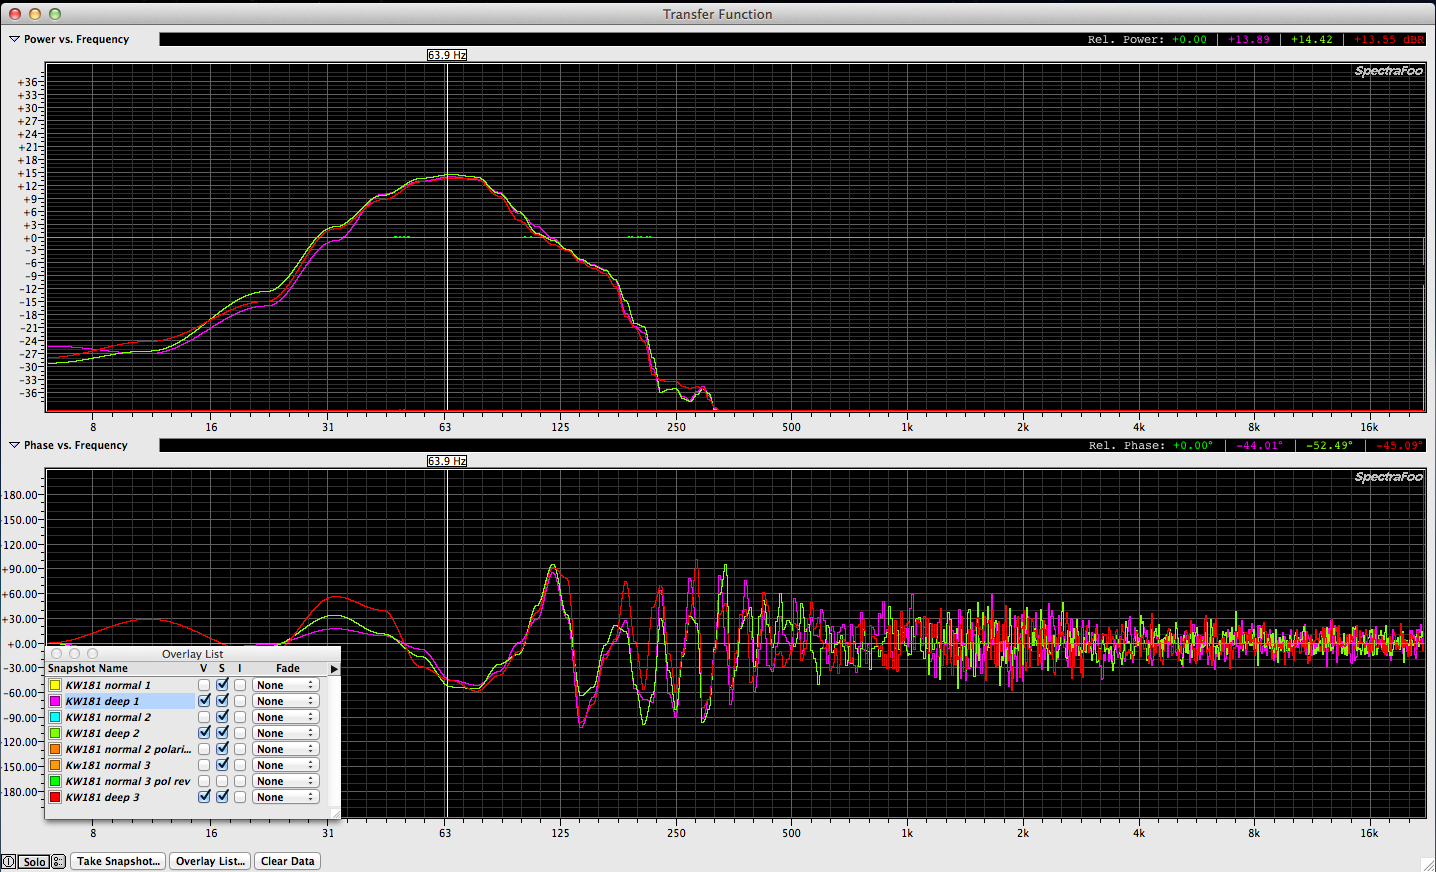
Here are (3) overlapping traces with the mode switch on DEEP.
QSC KW181 3 deep

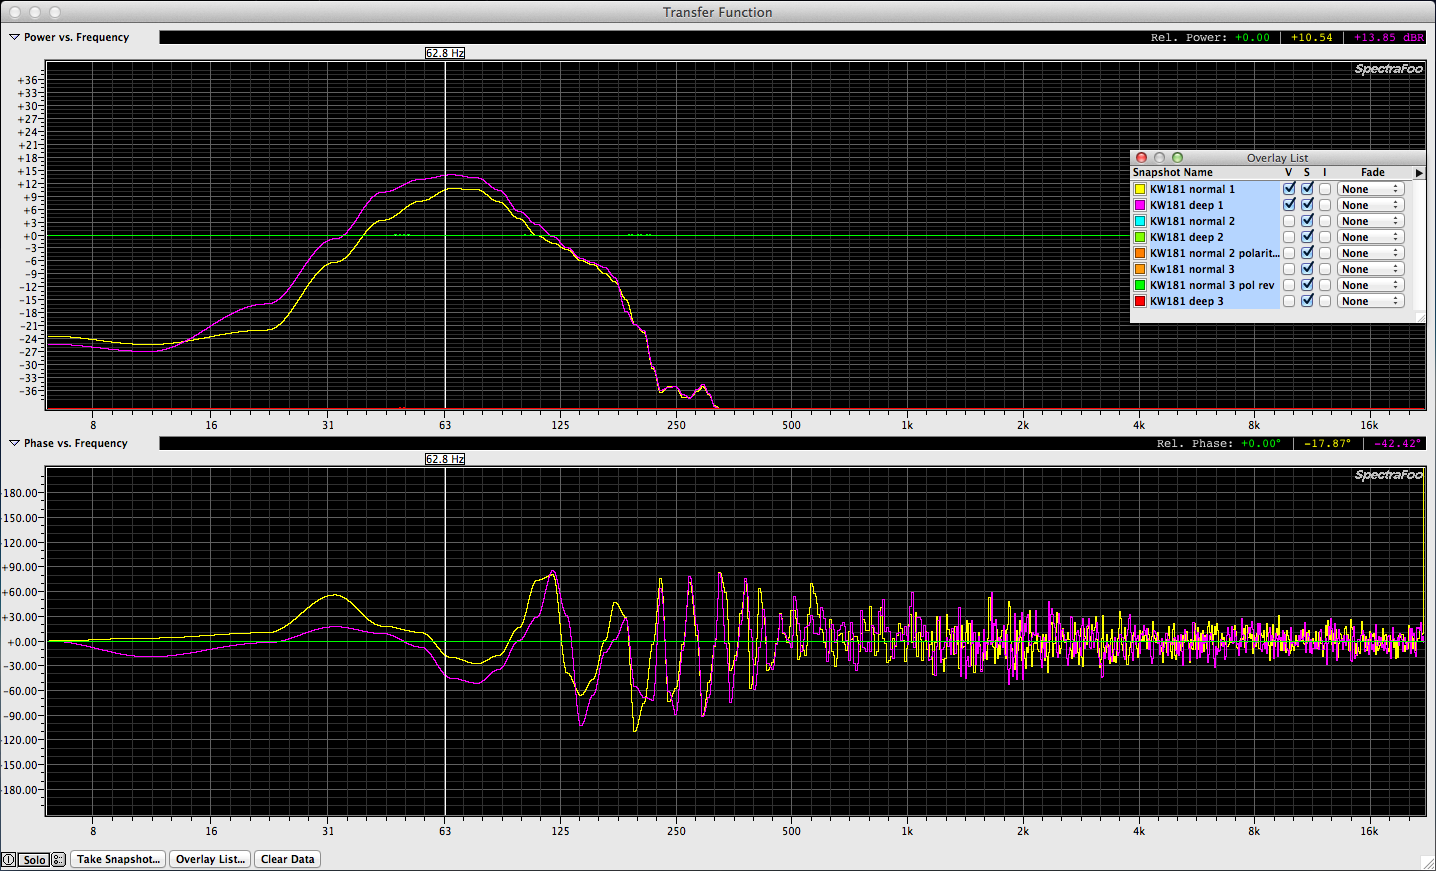
Here is a comparison of the same cabinet with the mode switch in both positions (NORMAL & DEEP).
QSC KW181 Normal & Deep mode

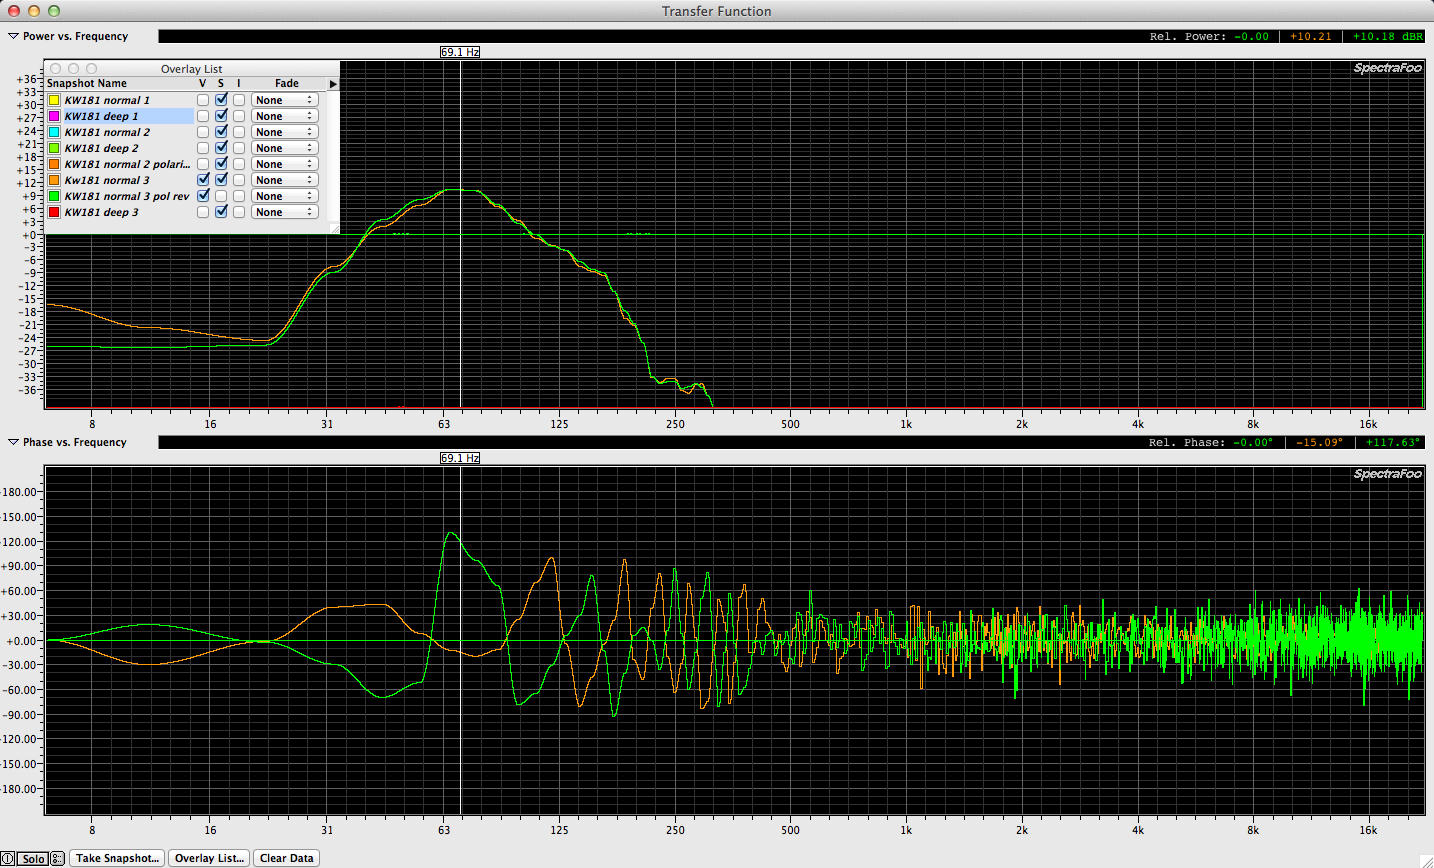
Note that when the polarity switch is reversed, the frequency response (measuring only one cabinet at a time) is unchanged but the phase response has rotated 180 degrees.
QSC KW181 plus & minus polarity

WIKI – Audio Analyzer

This wiki article is totally related and relevant to the conversation of audio measurements. Something has to measure and verify the gear we all use to capture, mix, process and reproduce audio and the tools discussed below cover those needs as well as being able to perform measurements that we would make in the live audio field.

WIKI – Audio analyzer

NTi Audio – webinars on demand

Nti makes portable measurement tools as well as measurement microphones and such.

NTi Audio – website homepage

You may be able to learn some useful stuff from watching this series of video’s even if you don’t have an NTi measurement system.

NTi Audio – webinars on demand

Here is a good explanation of “frequency weighting for sound level measurements”

NTi Audio – Frequency-Weightings for Sound Level Measurements

More NTi FAQ can be found here:

NTi Audio – FAQ

System Design & Optimization versus Existing System Optimization

I recently realized that there are two distinct branches on the live sound measurement tree. The larger and more complicated branch being system design and optimization. What is the smaller branch? Existing system optimization. Depending on the venue and house staff, my “optimization” scope might be as limited as tuning the entire system via the console EQ. In this case, I may end up with a system that doesn’t perform well but not have any other option.

A systems designer that is installing a new sound system typically has the luxury of choosing the location of each speaker (within the restraints of the physical space) dictating where each speaker is aiming and measuring & processing every zone independently. Then taking on a more holistic view of the system and refining further.

When you walk into a venue and they take the L/R out of your console, you make have that much control only. Meaning you will get to optimize the system with your board eq or your own DSP upstream of the house processing. With a more flexible design you may have L/R/Sub/Front Fill/Delay feeds and control of all those zones. All that is great if you have the time to break the system into it’s parts and optimize each piece before recombining it. Based on conversations with world class system measurement engineers time is always a limiting factor. It may even be THE limiting factor. What good is a road case full of optimization gear if it never gets used? None. I probably own a measurement rig now that can cover any gig but have never used it all at one time. Why? Time. Much of what I do at this point as a measurement engineer is voluntary (highy recommended) which typically allows more time than a typical paying gig would. When I worked with Howard Page of Clair Brothers a few years ago he made it very clear that you need to have your rig well put together, labeled and should be able to be up and running in a matter of minutes. Then you need to be able to taken a typical system’s optimization in 30 minutes or less. One of the ways to do this is to avoid wires. Howard’s Smaart rig is based on a Lectrosonics TM400 RF and appropriate measurement mic. With a wireless measurement rig, you can move fast. Especially if you have an assistant that can place the mic and then move it to the various measurement spots for you. That is the roll I played for Howard.

I do not think that the 30 minute target can be achieved without a wireless measurement rig. Let’s say you’re measuring L/R/Sub/FF/under balc delay/ over balc delay which was the case on the gig I worked with Howard on. Even if you skip measuring L or R and only measure one side of the mains, you’re still measuring 5 zones. Some that are a great distance away from others.

Let’s establish a few goals based on my experience working with Howard.

1. your rig needs to be quick and easy to set up. Target time of less than 5 minutes before you can be measuring your first zone.

2. your concept of how to tackle a system needs to be

Bob McCarthy on sound waves – how size and scale affect audio decisions

svconline.com – Bob McCarthy on Sound Waves

QUOTE:

“CONCLUSION

We can’t see the size of sound directly, but there is great benefit to being able to visualize it in our minds. Modern audio analyzers are very helpful in this regard since they show us phase, from which we can find the wavelength. These modern analyzers are the best learning tool to help us to acquire the ability to see sound in the room.”

Bass Performance Hall’s Meyer 700HP & 650P sub details

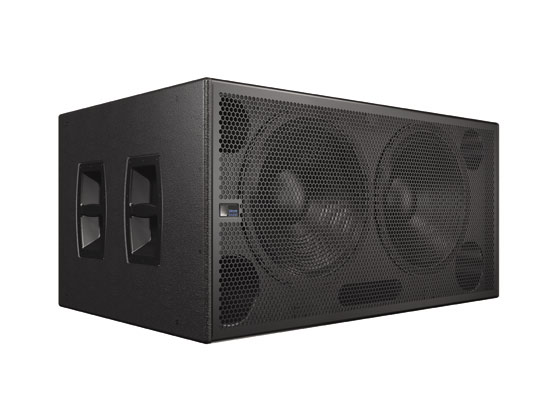
The house sound system at Bass Performance Hall in Fort Worth Texas includes (4) Meyer Sound 700HP subs located on the deck & (4) Meyer Sound 650P located in side boxes on level 2 and 4.

Meyer Sound 700-HP

Meyer Sound – 700HP data sheet PDF

Frequency Response : +/- 4dB from 30hz to 125hz
Phase Response: +/- 30 degrees from 45hz to 145hz
Maximum SPL: 136 @ 1 meter
Dynamic Range >110 dB

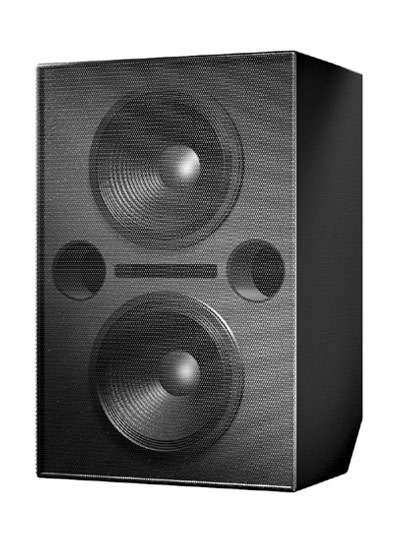
Meyer Sound 650-P

Meyer Sound – 650P data sheet PDF

Frequency Response : +/- 4dB from 28hz to 100hz
Phase Response: +/- 30 degrees from 45hz to 145hz
Maximum SPL: 136 @ 1 meter
Dynamic Range >110 dB

The 700HP setup is a double cabinet stack L/R onstage edge configuration due to the physical limitations of the space. There are also a pair of Meyer Sound 650P (one per side) in box seating area nearest the proscenium on level 3.

add photos

and measurement traces