Audix TM1 / TR40a / TR40 comparison & microphone calibration

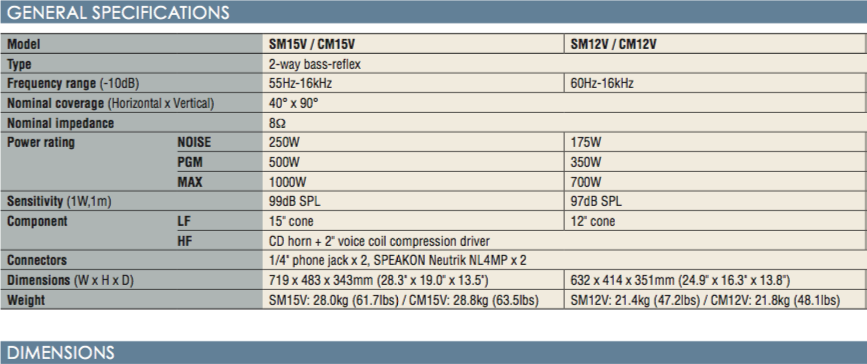
Having recently acquired a used Audix TM1, I was curious to see how it compared to it’s predecessor, the Audix TR40a and it’s predecessor the Audix TR40. As a sound source, I used a Genelec 1029a self powered speaker.

Genelec 1029a frequency response
Genelec 1029a off axis response

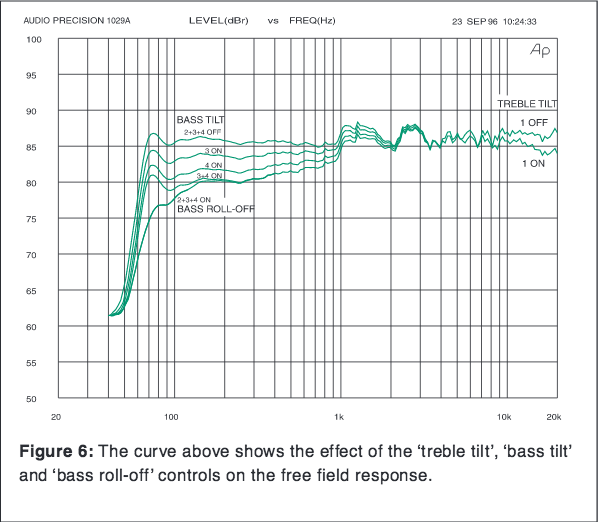
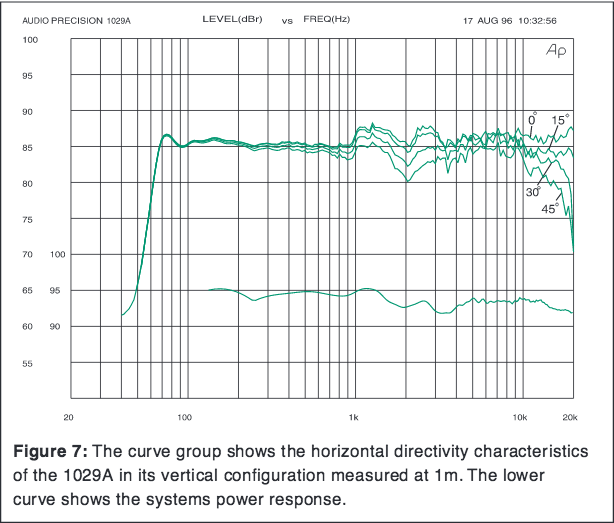
The following information gives us a baseline of what to expect when we measure.
Genelec 1029p specs

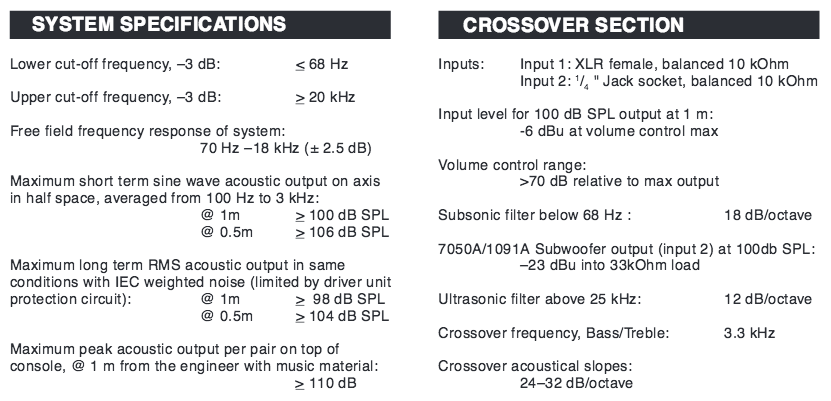
genelec.com – 1029a data sheet PDF

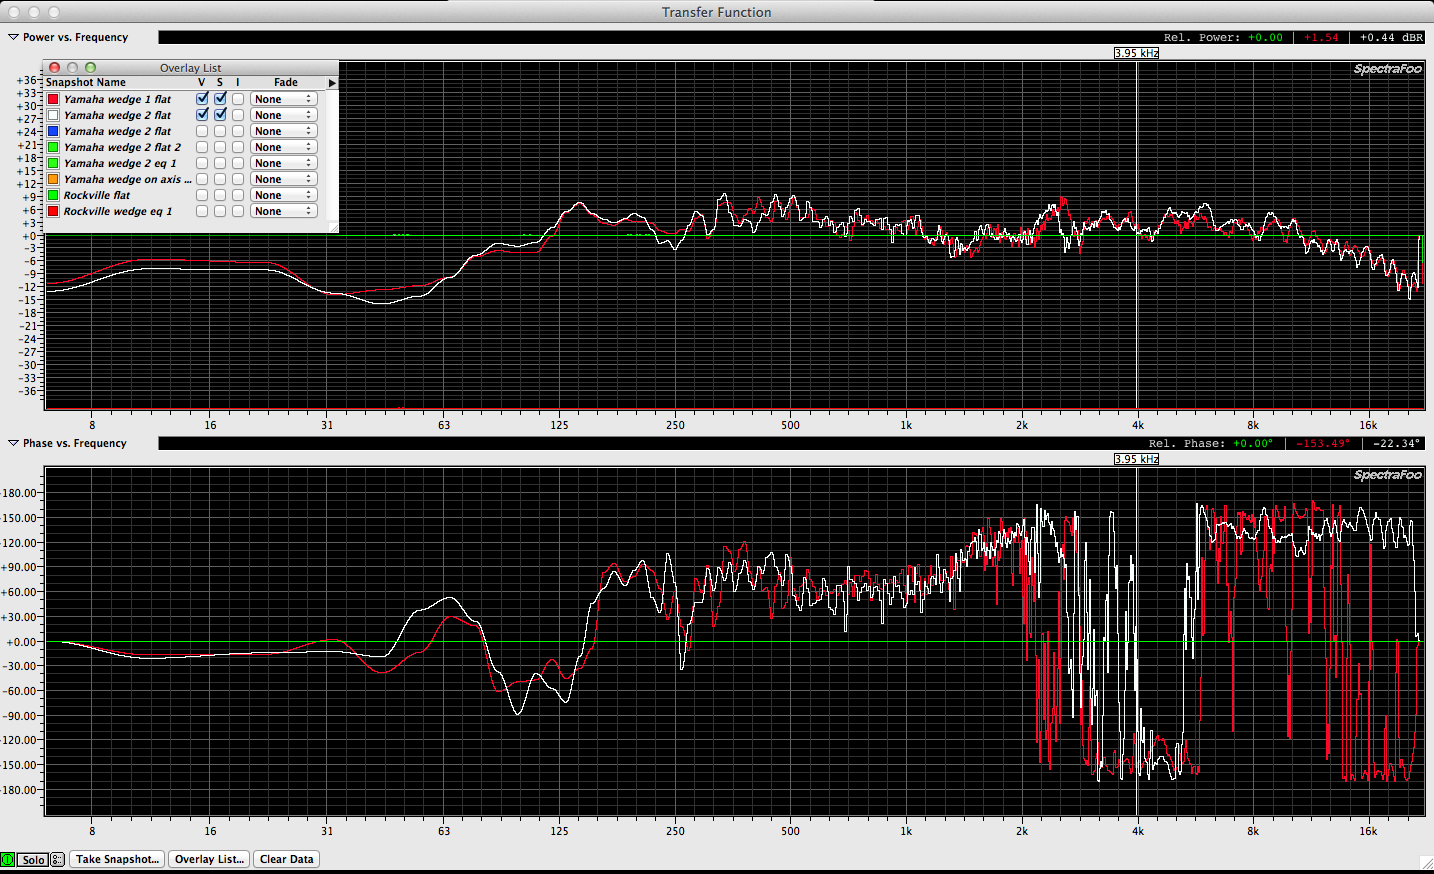
Keeping that in mind, the first measurements I made were of my Earthworks TC40K matched pair and the Audix TM1.
Audix TM1 & Earthworks TC40K Matched pair
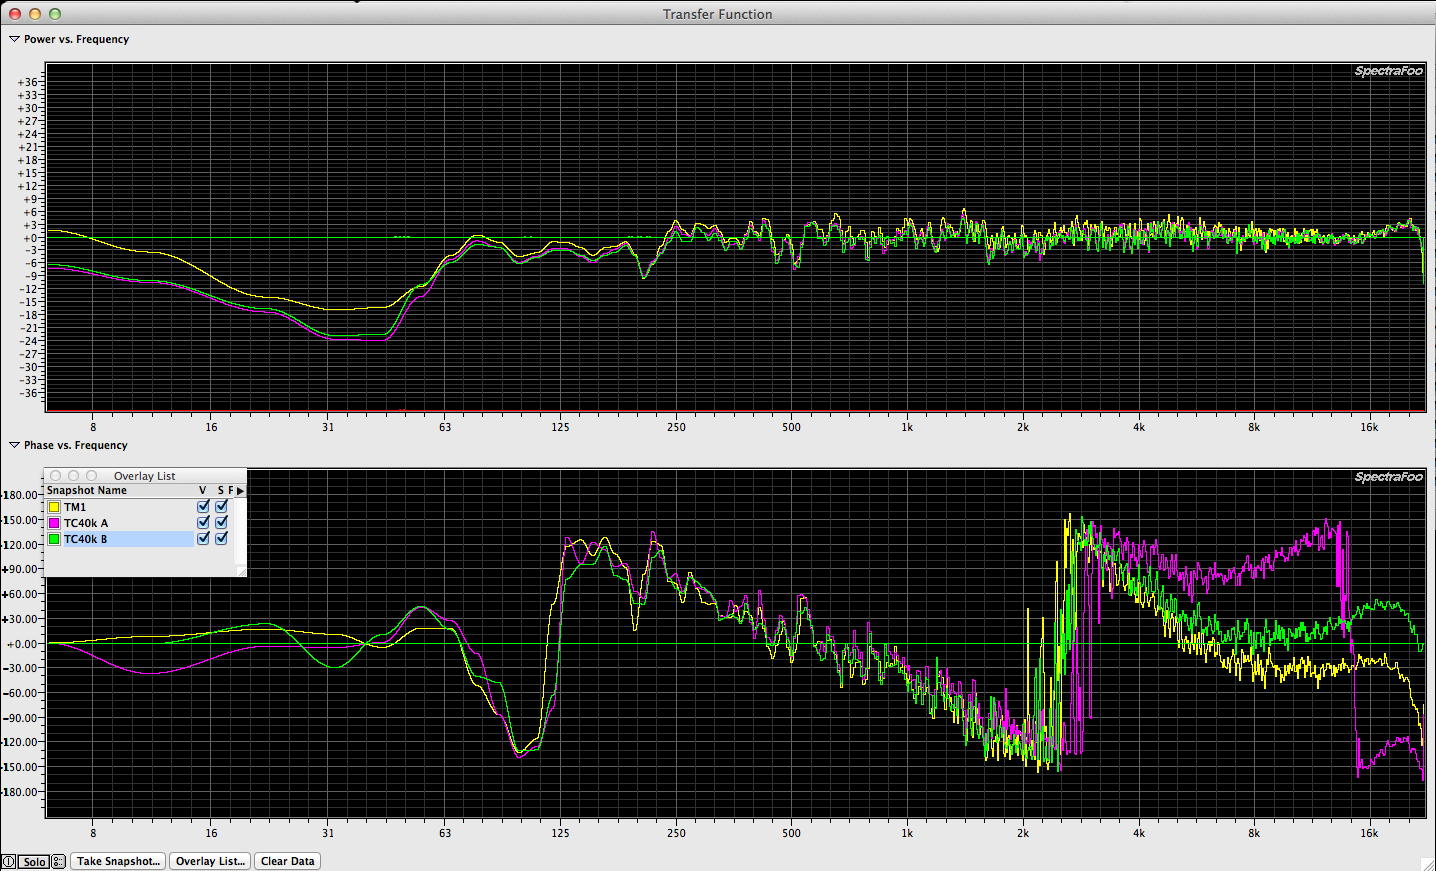
Note the TM1 closely matches the TC40K matched pair. Note where the phase rotates around 3.3 kHz. Note how the low frequency response begins to roll off around 70hz and the high frequency response begins to roll off around 20 kHz. All supported by the specs Genelec provides.

Having verified the TM1 against two Earthworks TC40K mics and satisfied with those tests, I can trust the TM1 for measurement purposes and use it as a reference point for all the other Audix mics in my kit. (3) Audix TR40, (1) Audix TR40a, (1) Audio TM1.

Audix all with offsets

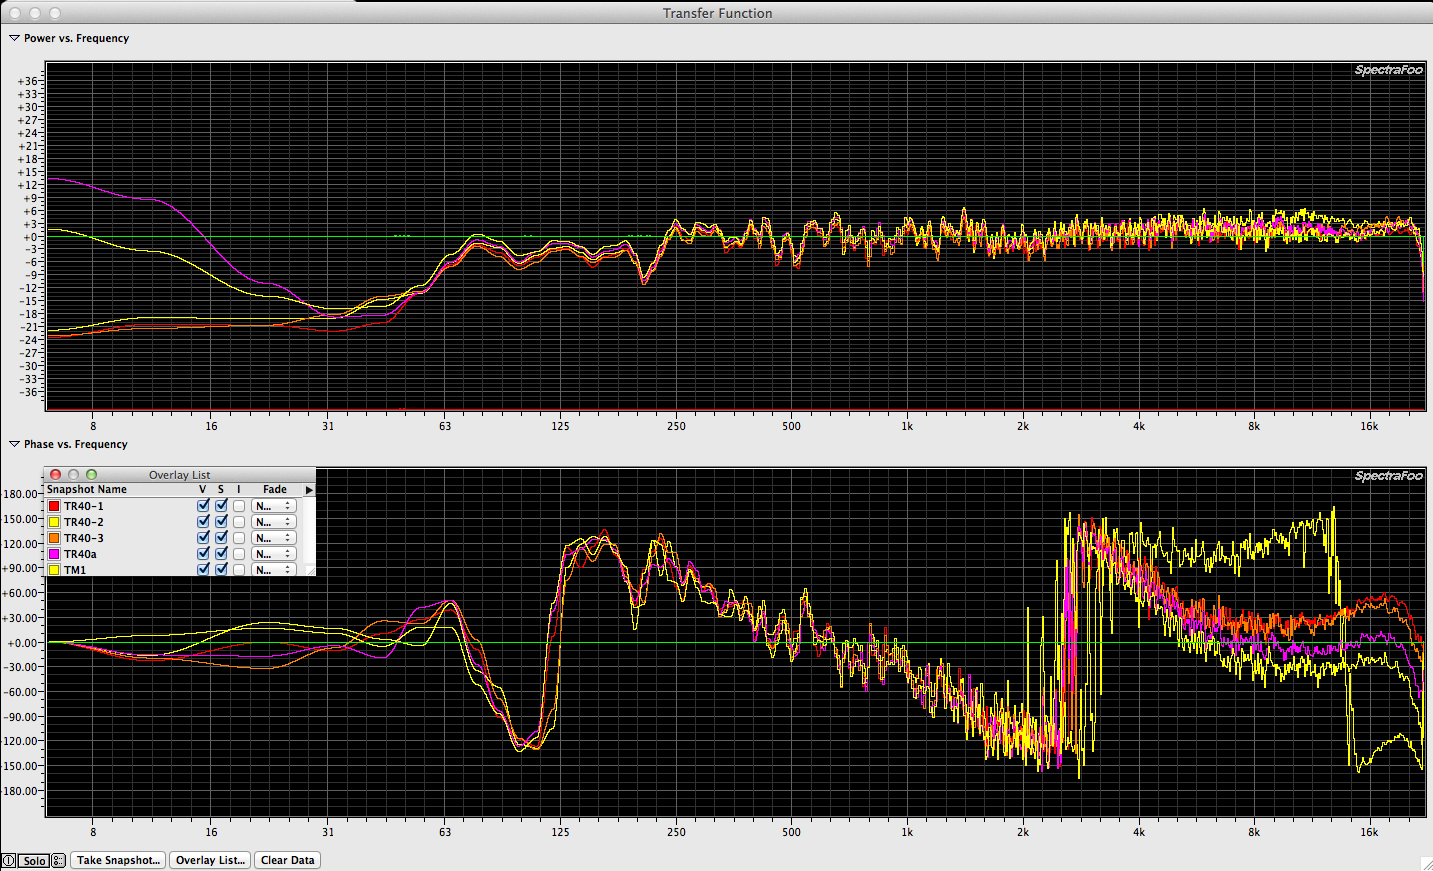
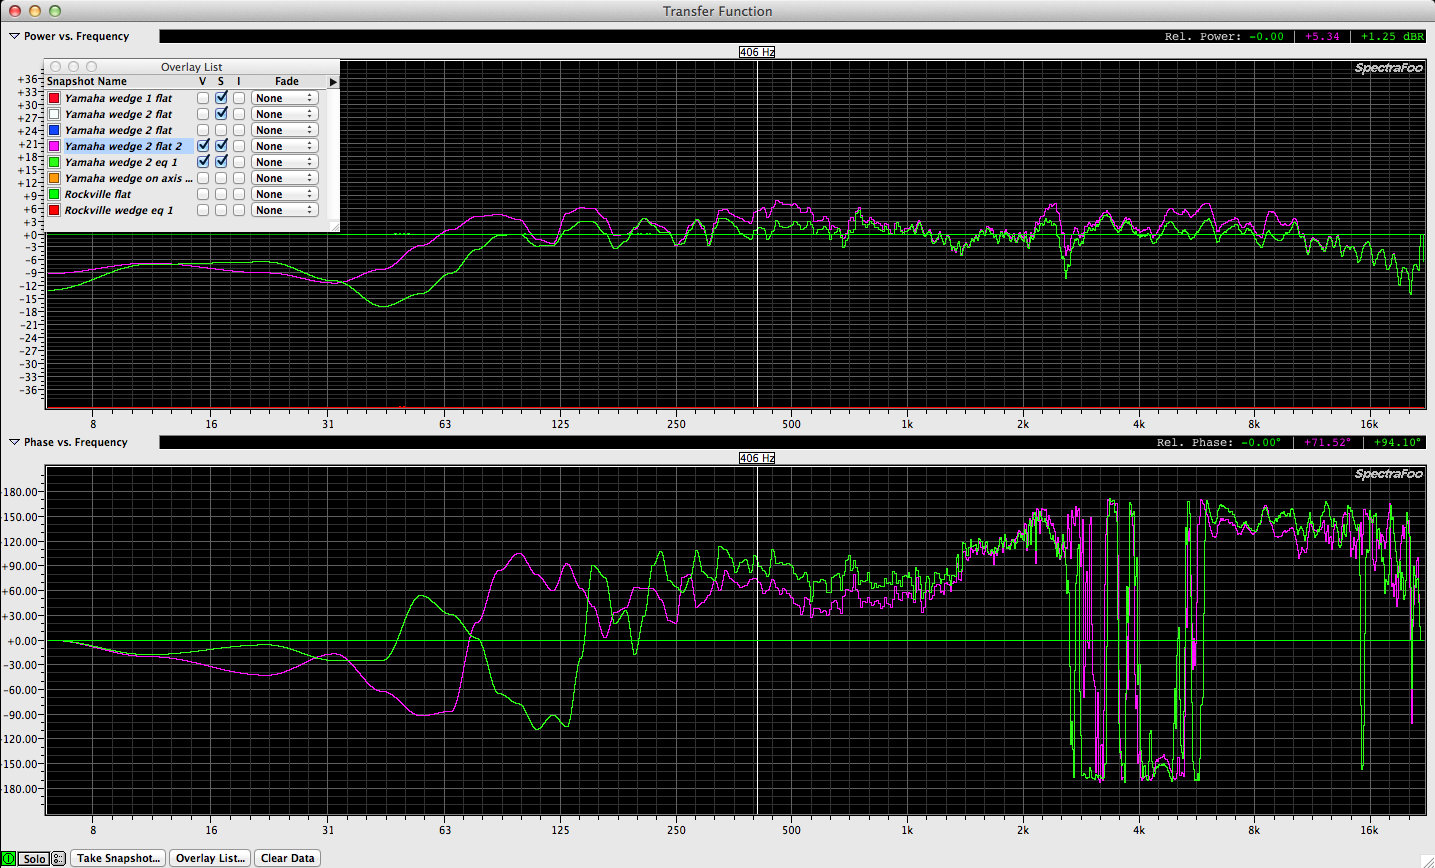
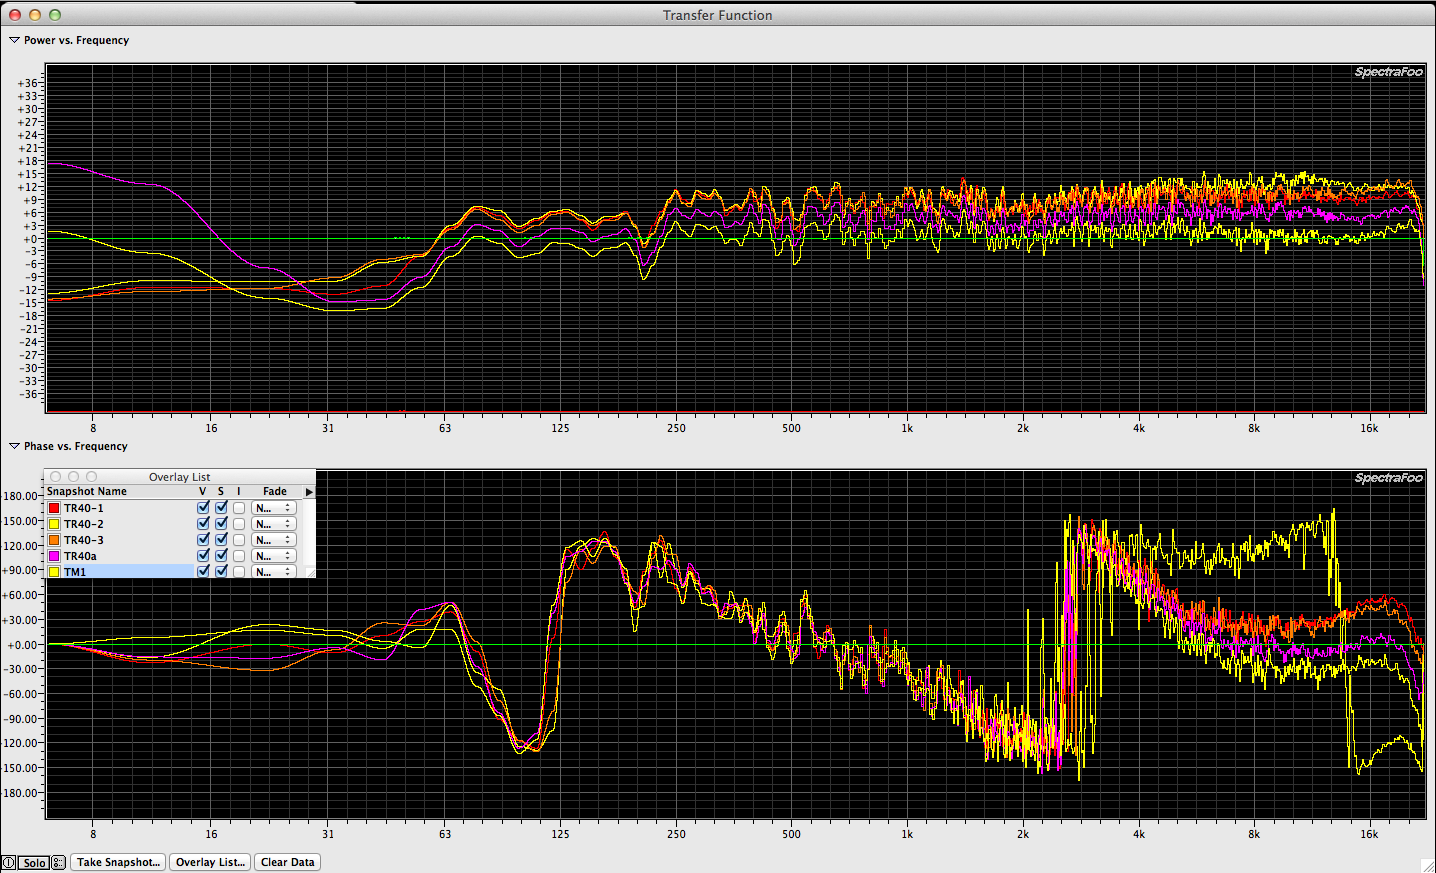
Notice that the pink trace rises up a bit between 4k and 16k. Notice that one of the TR40 (yellow trace) rises up between 4k and 16k even more. The rest of the mics are pretty close in frequency response. It would appear that (5) Audix mics – (3) different models from (3) different eras all match pretty well. True and false? Something that isn’t revealed by the data presented so far is that the sensitivity of the different models of mics don’t match. I had to setup offsets to make them match each other. So it’s true that the mics roughly match in frequency response but it’s false that they match in sensitivity.

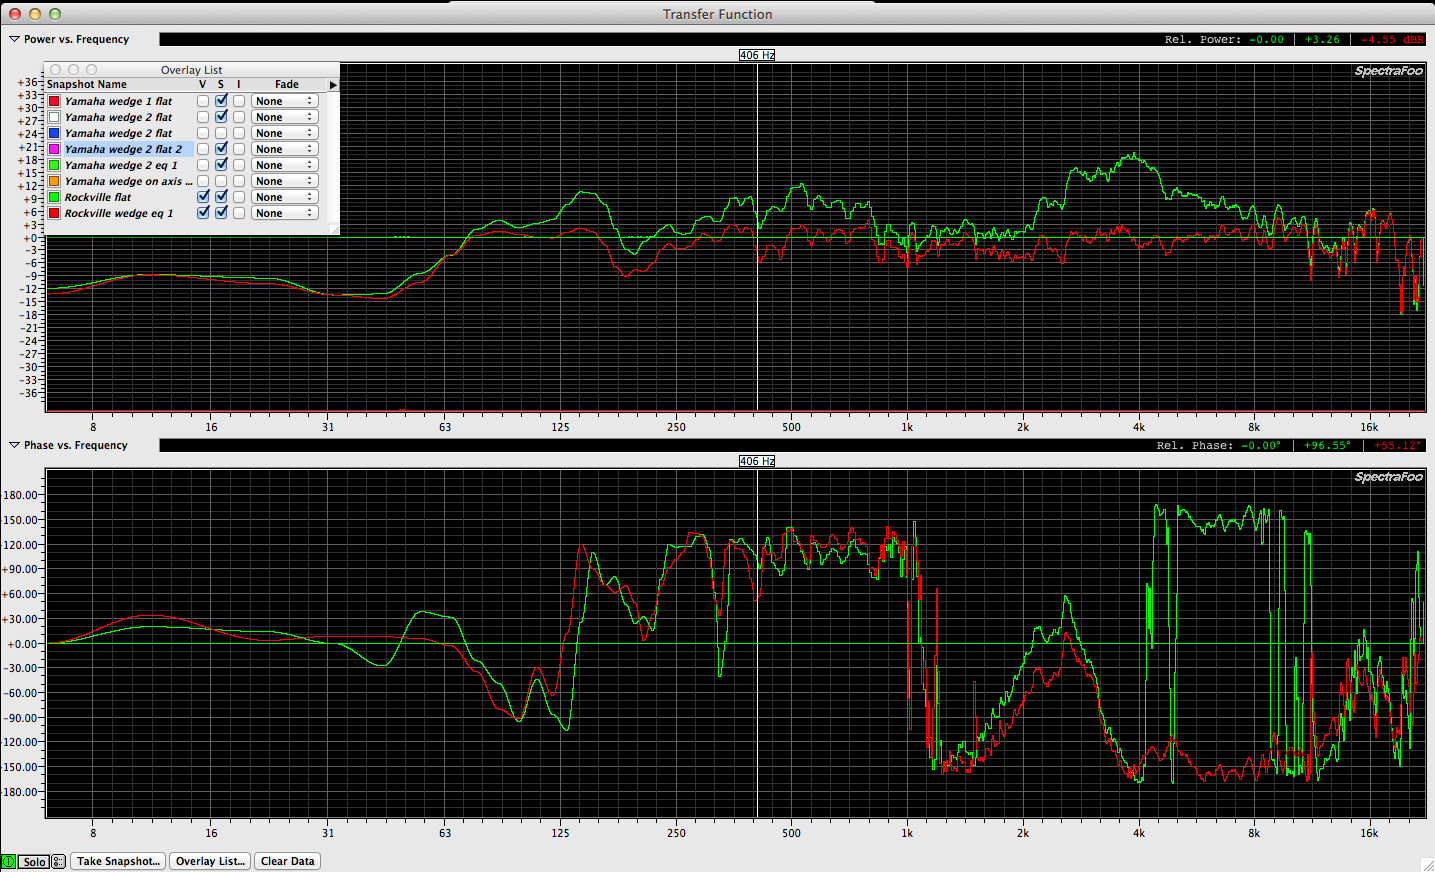
Without adding the offsets to the rig, the same measurement results would look like this:
Audix all without offsets

The following offsets were necessary to match the mics in level.
Audix TR40-1 = -9db
Audix TR40-2 = -9db
Audix TR40-3 = -9db
Audix TR40a = -4db
Audix TM1 = 0db (no offset)

The difference between each mic relates to it’s sensitivity and we need to pay close attention to this detail if we are to calibrate our rig and get useful information when using multiple mics. Calibrating your rig is the equivalent of making all the mics match each other in both frequency response and level. It’s tempting but we can’t assume that mics from the same manufacturer and model will match in sensitivity or frequency response. You get what you pay for and one of the things you get with higher quality mics is consistency. I’ve heard horror stories about certain brands of measurement mics and how different the mics are from mic to mic, batch to batch and over time.

Bob McCarthy makes it clear in his workshops that microphone calibration is mandatory when using multiple mics. Even if yesterday the mics all measured fine, one or more may of been damaged and without verification you would be making decisions based on false information. Considering the vast majority of the optimization process involves setting accurate levels between different speakers using different mics for reference, doing so with mics that aren’t calibrated to match in level would be rather fruitless.

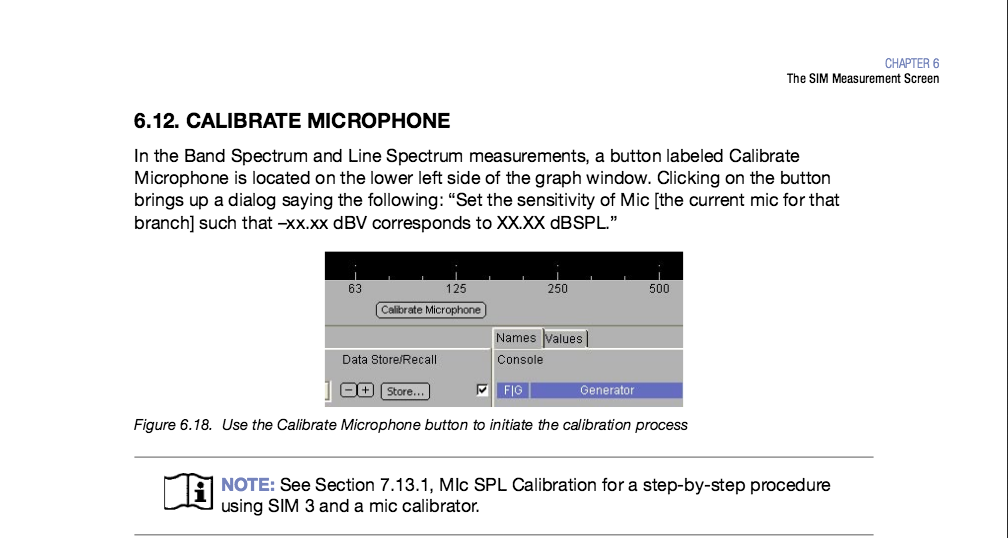
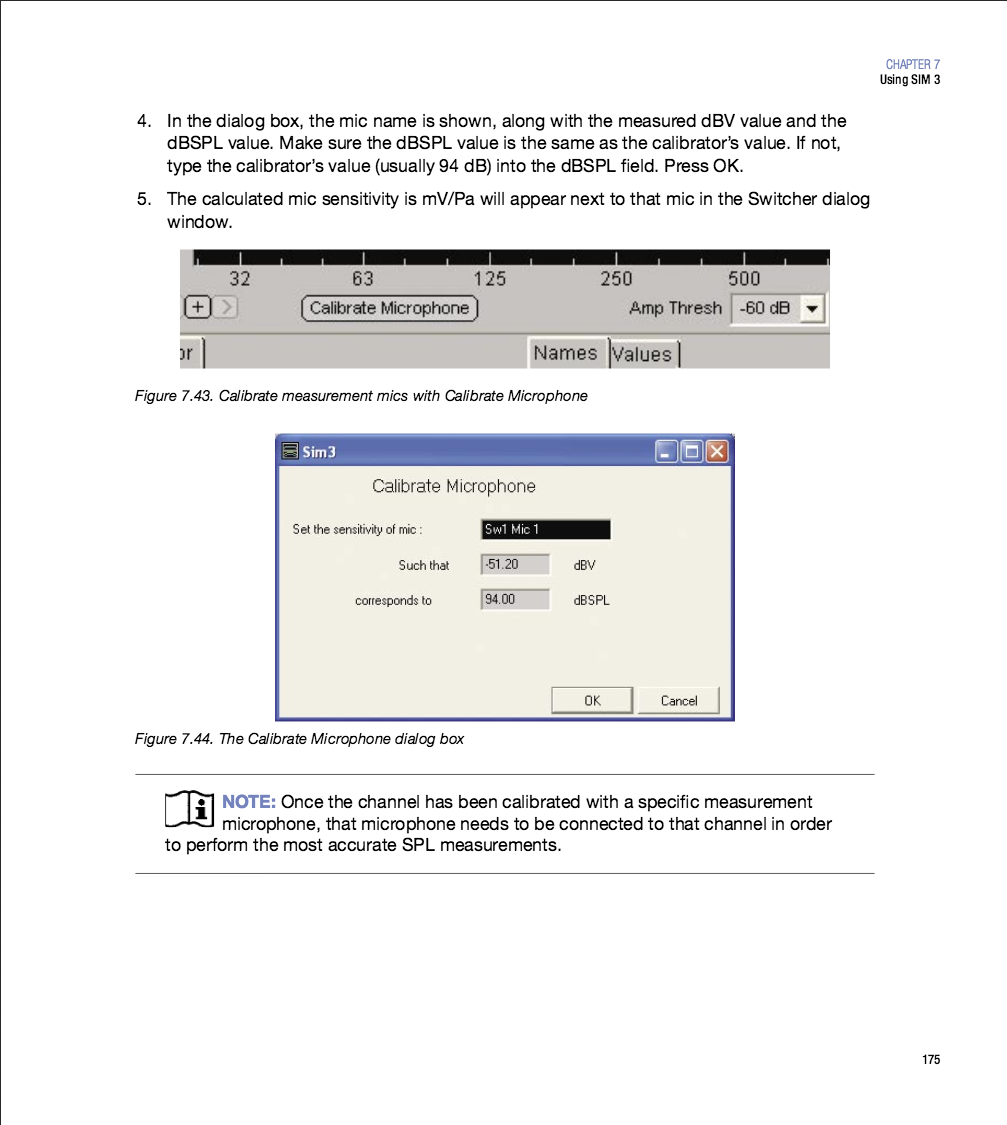
Meyer Sound’s SIM3 user guide provides the following information related to this topic:
Meyer Sound SIM3 Calibration Microphone 1
Meyer Sound SIM3 Calibration Microphone 2
Meyer Sound SIM3 Calibration Microphone 3
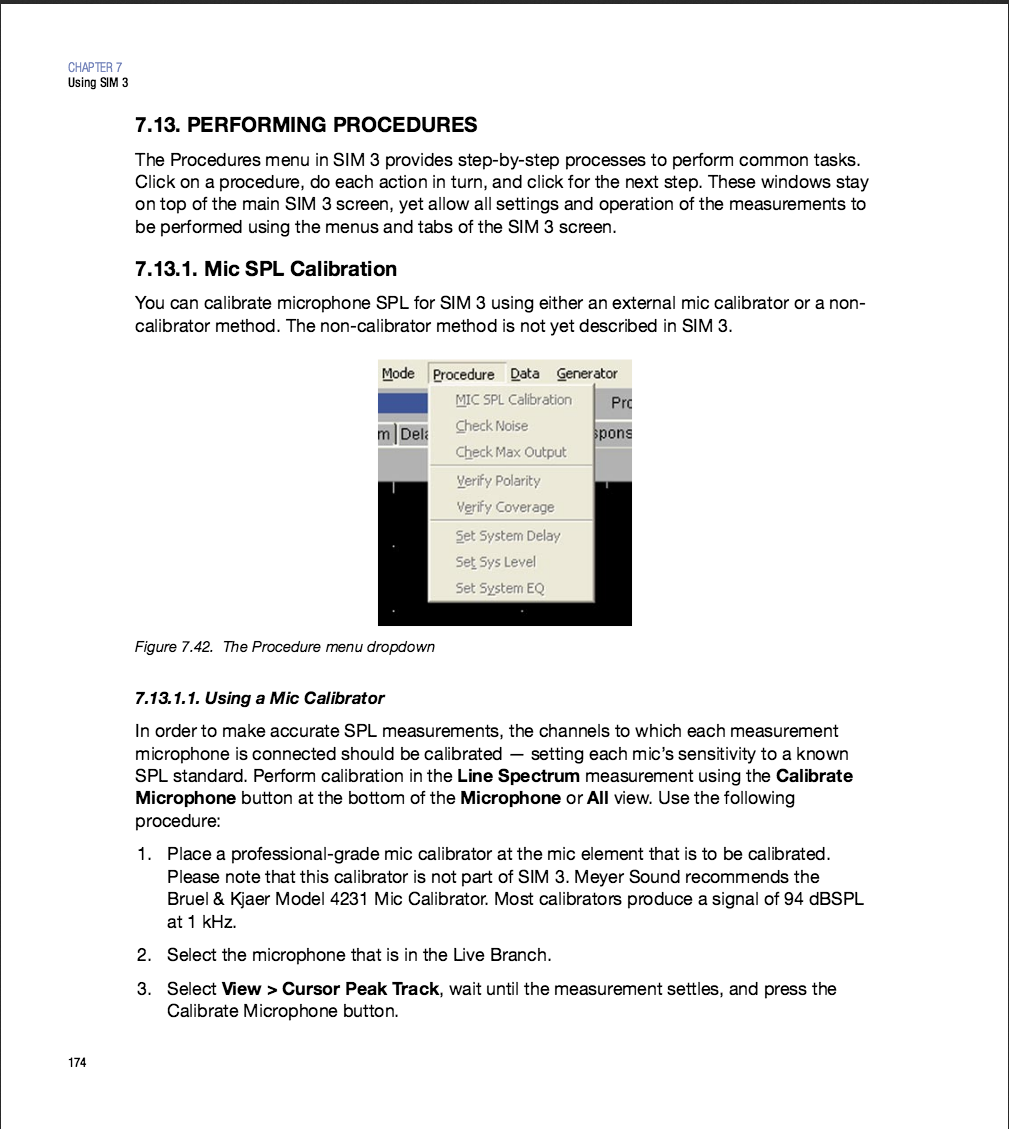
Meyer Sound – SIM3 user guide PDF

The last statement Meyer makes is worth repeating.
QUOTE:
“Once the channel has been calibrated with a specific measurement microphone, that microphone needs to be connected to that channel in order to perform the most accurate SPL measurements.”
END QUOTE:

The TM1 sensitivity spec provided by Audix via their spec sheet = 6mV / Pa @ 1k
audixusa.com – TM1 specs PDF

The TR40a sensitivity spec provided by Audix via their spec sheet = 17.9 mV / Pa @ 1k
Interestingly, the spec sheet I found for a TR40a isn’t available on Audix’s website and it disagrees with the official Audix archive page which states 12mV / Pa
audixusa.com – TR40a info

The TR40 sensitivity spec is not available from Audix but I found spec sheet PDF here:
Audix TR40 spec sheet PDF

Summary:
TM1 = 6mV / Pa @ 1k
TR40a = 12 mV / Pa OR 17.9 mV / Pa (depending on whether you trust the Audix website or the TR40a spec sheet PDF)
TR40 = 14 mV / Pa

Regarding microphone sensitivity, here is an article called “Understanding Microphone Sensitivity” by Jerad Lewis of Analog Devices.
analog.com – Understanding Microphone Sensitivity
Here is the PDF version:
analog.com – Understanding Microphone Sensitivity PDF

What I am going to do next is go through the SPL calibration process in Smaart and see how all that goes. Hopefully I can verify one way or another what Audix has to say. More soon.

Audix TM1 – craigslist

I have a habit of checking Craigslist for used measurement mics and honestly, have never seen a listing but a few days ago I came across a used Audix TM1. The listing was for $100. Since the mic sells new without the calibration chart for $299, I thought it was worth checking into. After all, I’m not always interested in putting my matched set of Earthworks mics out for basic measurement purposes due to the risk involved.

Yesterday I met the owner, exchanged $100 and brought the mic home. In an ideal world, when purchasing a used measurement mic, you would measure the mic against a known mic before making the purchase. In this case I met the guy in a parking lot. Not a lot of options for an A/B comparison but if we’d met at a church or something I might of gone to the effort of verifying the mic before I bought it. The mic did appear to be in good share and the seller was knowledgeable of the measurement concepts and was a previous Smaart user so based on the sale price, I bought it and took the risk.

For any used measurement mic purchase, I recommend carefully inspection of the mic for signs that it might of been dropped or any deformity to the tip. A mic with a bent tip or one showing signs of damage may be totally compromised but still produce sound. Even a small dent in the windscreen can affect the accuracy of a mic. Buyer beware. The only way to know for sure is to measure a known mic and then the unknown mic and compare the two. Since I didn’t do this procedure before I bought it, I’m going to do it now.

RF explorer – first day

Do yourself a big favor and order a USB A to mini-B cable either when you purchase your RF Explorer or soon afterward. Without it, you can’t use the unit with scanning software apps or even charge it. Sorta like getting an RC car for Christmas but no batteries.

After sourcing the correct cable this morning, I downloaded the USB driver for the unit, loaded it on to my PC and rebooted as instructed. I then plugged the unit in to my PC and the device was immediately recognized and the driver loaded successfully.

The various files needed to install can be found here:

j3.rfexplorer.com – downloads
rfexplorer.com – downloads
Touchstone & Touchstone Pro – downloads
While not an official release from nutsaboutnets, there is a Mac scanner app for the RF Explorer.
Irfexplorer app for Mac

Not to get ahead of myself, I installed the free Touchstone scanner app. When I ran it the first time it said I needed to install Microsoft’s NET Framework 4. I found the offline installer for the current version and now Touchstone is working.

MS NET Framework 4.5.2 offline installer

I did have to reboot after installing the NET Framework software before Touchstone would connect with the RF Explorer.

Now that I have a working system, what do I do with it?

This is where having a friend who is years ahead of me comes in handy. He has already explained how to configure things and what software he uses and why. Those details to come…

One point of interest worth mentioning:

The RF Explorer unit comes with a Nagoya Telescoping NA-773 antenna. Logic suggests that an antenna must be adjusted in length to optimize it for a certain frequency range. This is what the RF Explorer manual has to say:

QUOTE:

This is a telescopic, high quality 2dBi antenna ideally suited for 144MHz and 430MHz bands, typically used in two way radios and HAM bands.

It offers a good response in all frequencies below 1GHz. Use this antenna in all ranges of frequencies between 15-1000MHz. In some cases collapsing partially or totally may provide better response in the highest frequencies of the range.

The metallic structure of the antenna is a direct connection to the core RF connection, therefore take precautions for the antenna not being in contact with strong electric fields or DC current.

This antenna is included in RF Explorer WSUB1G, RF Explorer 3G Combo and RF Explorer ISM Combo.

END QUOTE:

So indeed for the frequencies most used for RF mics in the US, the antenna full extended is not tuned well for the purpose. How does one tune an antenna for properly receiving radio signals?

This is what SHURE has to say about antenna lengths:

SHURE – Antenna setup PDF

QUOTE:

The size of a 1/4-wave antenna is approximately
one-quarter of the wavelength of the desired frequency,
and the 1/2-wave is one-half the wavelength. Wavelength
for radio signals can be calculated by dividing the speed of
light by frequency (see “The Wave Equation”). For example,
a 200 MHz wave has a wavelength of approximately 6 feet
(2 m). Therefore, a 1/2-wave receiver antenna would be
about 3 feet (1 m) long, and a 1/4-wave antenna would be
about 18 inches (45 cm). Note that antenna length
typically needs to only be approximate, not exact. For VHF
applications, an antenna anywhere from 14-18 inches
(35-45 cm) is perfectly appropriate as a 1/4-wave
antenna. Since the UHF band covers a much larger range
of frequencies than VHF, 1/4-wave antennas can range
anywhere from 3 to 6 inches (7-15 cm) in length, so using
the proper length antenna is somewhat more important.
For a system operating at 500 MHz, a 1/4-wave antenna
should be about 6 inches (15 cm). Using an antenna
tuned for an 800 MHz system (about 3 inches, 7 cm,
in length) in the same situation would result in less than
optimum pickup. Wideband omnidirectional antennas
that cover almost the entire UHF band are also available
for applications where receivers with different tuning
ranges need to share a common antenna.

END QUOTE:

Antenna length formula

RF Explorer – RF scanner arrives

Today is a big day here at audiomeasurments.com

The RF Explorer WSUB1G 240mhz to 960mhz scanner arrived today. I’m not sure why it took me so long to bite the bullet and purchase an RF scanner considering how much RF work I do and how important it is that it work! A sort of parallel to knowing I needed a audio measurement rig and the skills to use it but waiting anyway. I guess the biggest stumbling block to getting a RF scanning rig was the price. The TTI PSA1301T RF scanner recommended to me by Professional Wireless Services when I first checked was around $2000. The model has been discontinued but here it is for reference.
TTI PSA1301T – 1.3 Ghz RF Spectrum Analyser webpage
It appears the newer version is the PSA3605 and PSA6005 units the cost between $2000 and $3000.
TTI PSA series 5 RF Spectrum Analyzers webpage
Here is the spec sheet for the current devices:
TTI PSA series 5 – spec sheet PDF

Once you have a scanner you also need software to coordinate the data.

The industry standard is Professional Wireless Systems “IAS” (Intermodulation Analysis System) software. $250 for the Basic Edition and $550 for the Professional Edition:
Intermodulation Analysis System – webpage
IAS purchase webpage

One of the hangups with purchasing an RF scanner rig or even an audio measurement rig has been the fact that my clients aren’t going to be interested (in general) with paying extra for this sort of service. Meaning that I can’t just tag on an extra $25 an hour because I have the needed tools. Consequently, having an audio measurement rig & RF scanner rig is an investment in your own production value which may not earn you a dime but may save your reputation. It will certainly make it easier to have solid RF on a show and a better sounding PA system. I’d argue both of those are a “requirement” of the gig. Easy to say now that I’m in the club on both fronts.

The decision to purchase an RF scanner and RF coordination software package was made after a recent show where of the two RF mics used on a show, one of them was taking RF hits. I decided at intermission, “Order RF scanner on Monday…” “I will never do another production that uses RF without a scanner…” The rest is history.

Fortunately one of my favorite Smaart 7 measurement engineers who also has an RF scanner rig brought his RF Explorer rig into the theater I was working in to do a preproduction RF scan of the venue for an upcoming show.

He uses an RF Explorer WSUB1G unit.

http://rfexplorer.com/

For less than $150 to get into one (after shipping and ordering the USB cable you need to charge it and transfer RF data, I couldn’t stall any longer. My unit arrived today.

A few notes to share for those who might follow my lead.

The RF Explorer scanner comes in a few different models. The base unit is the WSUB1G which can scan between 240mhz and 960mhz.

An RF Explorer without an external computer running software has limited appeal. Fortunately there are a number of options that support the device.

These are scanning apps that will work with an RF Explorer unit. Unfortunately there are limited options for Mac OSX users but there one now:

RF Venue “Vantage” – website

The rest of these apps are all PC only:

First up, the offerings from nutsaboutnets in order of cost and functionality.

A free app is available for the RF Explorer unit called Touchstone:

nutsaboutnets “Touchstone” RF Spectrum Analyzer Software – webpage

Note that there is a PRO version that add some extra features for $49.

nutsaboutnets also offers “Clear Waves” which is the only spectrum and intermodulation analysis app I am aware of. I’ve seen a touring Broadway production come through using Clear Waves to coordinate RF.

nutsaboutnets “Clear Waves” – website

Then there is Stage Research’s “RFscanner” app which is a companion to their “RFguru” intermodulation app.

Stage Research “RFscanner” – webpage

Stage Research “RFguru” – webpage

Last but certainly not least is Professional Wireless Services “IAS” (Intermodulation Analysis System). I’m fairly certain that this one is king of the hill when it comes to RF coordination.

“IAS” – webpage

If there are others I’ll add them to this page as I learn of them.

In the meantime, a special note regarding RF scanners.

WARNING!!!

An RF Explorer RF scanner is designed to measure incredibly low level signals. Consequently, it’s a very sensitive device. It is possible to overload the input circuitry and blow the thing up. Even when it’s not actually powered up, it’s still susceptible to this!!! One of the reasons I bought the least expensive model (WSUB11G) is because it’s a bit more robust than some of the combo models when it comes to this matter. Here is a webpage with that explains how to treat an RF Explorer so that the chance of being damaged is minimized.

RF Explorer – protecting your instrument

The antenna connector on the RF Explorer is an SMA type.
WIKI – SMA connector

The antenna that comes with the RF Explorer WSUB1G device is a Nayogo N-773. I’ve read some bad things about this antenna.

ham radio blog – best and worst from Chinese origin

“The worst antenna ever: Nagoya NA-773.

It looks like a brilliant idea: combining a loading coil at the base with a telescopic antenna. Unfortunately this antenna is the most dangerous one on earth. Whatever the length, the SWR stays close to 1:3.0. In essence 25% of the output power bounces back into the electronics, and this amount of reflected energy is not something most PA modules can handle for a very long time. To make matters worse, reception also suffers. The gain (cough cough) of this antenna is estimated to be equal to, or worse than minus 6dBd. In other words: deaf as a post. This would make a fine present for someone you hate to the core. Total number of copies tested: three.”

Zobel network / Boucherot cell

I spent the evening watching a custom loudspeaker being built at Toby Speakers which included some of the beginning work on the crossover network.

tobyspeakers.com

In the process, the term “Zobel filter” came up and after reading about it, I realized what important the concept actually is to speaker design. I’m surprised I’ve never come across it before.

WIKI – Zobel network

QUOTE:

Zobel networks are a type of filter section based on the image-impedance design principle. They are named after Otto Zobel of Bell Labs, who published a much-referenced paper on image filters in 1923.[1] The distinguishing feature of Zobel networks is that the input impedance is fixed in the design independently of the transfer function. This characteristic is achieved at the expense of a much higher component count compared to other types of filter sections. The impedance would normally be specified to be constant and purely resistive. For this reason, they are also known as constant resistance networks. However, any impedance achievable with discrete components is possible.

END QUOTE:

Another name for the circuit is a Boucherot cell

WIKI – Boucherot cell

Boucherot cell circuit

QUOTE:

A Boucherot cell (or Zobel network) is an electronic filter, used in audio amplifiers to damp high frequency oscillations that might occur in the absence of loads at high frequencies. Named after Paul Boucherot a Boucherot cell typically consists of a resistor and capacitor in series, that is usually placed across a load, for stability.

It is commonly seen in analog power amplifiers at the output of the driver stage, just before the output inductor. The speaker coil inductance of a loudspeaker generates a rising impedance which is worsened by the output inductor generally found in analog power amplifiers; the cell is used to limit this impedance.

The documentation for some power operation amplifiers suggests the use of a “Boucherot cell between outputs and ground or across the load”.

Additionally, Boucherot cells are sometimes used across the bass driver (and mid-range) of a speaker system, in order to maintain a more constant driving point impedance as “seen” by a passive crossover. In this specific arrangement, the Boucherot cell is sometimes also known as a Zobel network.

Some loudspeaker crossover designs aim to stabilize impedance at high frequencies by including Zobel networks.

Electromagnetic Spectrum

I’ve been doing some research into RF based audio measurements and what immediately becomes apparent is that using RF based mics for anything is infinitely more complicated than using a cable. Even so there are times when RF based measurements are necessary due to time / distance / etc…

The term “radio frequency” is a man made term and it’s important to keep in mind that prior the the 1860s the only frequencies considered were visible waves.

WIKI – Electromagnetic spectrum

It’s helpful to look at the entire electromagnetic spectrum to understand where both audio frequencies and radio frequencies land. It’s also obvious that what we consider low and high frequencies in the audio world does not relate to the scale of electromagnetic frequencies.

0hz is equal to no frequency. 1hz is obviously a low frequency but is considered ELF (extremely low frequency). The same is true up to 30hz. 30hz to 300hz is considered SLF (super low frequency). 300hz to 3khz is considered ULF (ultra low frequency). 3khz to 30khz is considered VLF (very low frequency). 30khz to 300 khz is considered LF (low frequency). 300khz to 3mhz is considered MF (medium frequency). 3mhz to 30mhz is considered HF (high frequency). Yikes!!!

Obviously our scale and how we perceived frequencies is not in alignment the scale of the electromagnetic spectrum.

Relating to RF mics, we are familiar with the terms VHF and UHF but maybe not clear on what those ranges are in the context of the electromagnetic spectrum.

VHF = 30mhz to 300mhz
UHF = 300mhz to 3ghz (the range where most RF mics currently available are tuned to)

Moving up in the electromagnetic spectrum and skipping over microwaves which are next after radio waves, we eventually get into the visible radiation spectrum which covers a tiny sliver of the electromagnetic spectrum between 400 and 790 terahertz. Infrared (IR) landing between 300ghz and 400 terahertz and ultraviolet radiation (UV).

Staying on topic, for live acoustic measurements our interested in a the ELF to VLF region of the electromagnetic spectrum. One could even argue that what we’re most interested in when measuring live audio is the SLF (super low frequency) region starting at 30hz and going only partially upward into the VLF (very low frequency) range of around 15khz.

How to collect that data over the radio waves? I’ve spent the last few years looking into how to do that accurately and there are two things to share.

1. The list of tools is growing
2. The existing tools are relatively expensive

Compare a 100′ XLR cable to a Lectrosonics TM400 wireless measurement kit and the difference is startling.

100′ XLR = $25 to $75
TM400 kit = $2000

So why would someone spend $2000 on a wireless measurement rig when they can spend less than $100 on an XLR cable. One word. “TIME”! A typical procedure I’ve witnessed where a single mic gets moved around a venue to optimize each system / sub system might require hours to complete using an XLR cable. With a wireless measurement rig? Maybe 30 minutes to an hour. Maybe less.

As the available RF spectrum shrinks, manufacturers of pro audio wireless gear are forced to make changes to their products. The change that made RF measurement possible was a system that didn’t use a compander circuit which makes measuring audio with standard wireless gear inaccurate. Lectrosonics Digital Hybrid system was the first system I am aware of to allow for wireless measurements in the UHF range. If there were others first, please let me know. Next was Line 6’s 2.4ghz based X series which aren’t specifically designed for working with a measurement mic but have been adapted for that purpose by some. Most recently I learned that any of the 100% digital RF systems sold by Zaxcom in the UHF range are capable of accurately transmitting the desired data between transmitter and receiver. If the available RF spectrum continues to shrink, we may witness all pro audio wireless manufacturers moving in the 100% digital direction which may bring the cost of RF based measurement down. In the meantime, if you want an off the shelve solution that you can plug your existing measurement mic into, your options are limited.

Matched pairs & testing speakers

A friend of mine just purchased a used pair of reference monitors for his home studio. In trying to help him make sure they worked before he made the purchase I realized that having a matched pair of something is a fairly handy situation.

If you have a matched pair of measurement mics, you can use them to verify each other and therefore any other mic or speaker.

This is not possible with single mics. Even when dealing with the same brand and model of microphone, you should expect there to be differences in sensitivity and frequency response. There is zero motivation for a company to worry about tight tolerances if no one is willing to pay for consistency. For example, paying $100 (or less) for a measurement mic is a gamble and the odds of randomly finding two that match is probably on par with securing a winning lottery ticket. Obviously your odds are much better once your budget allows for purchasing a mic that comes with a custom frequency response and sensitivity value document but even then, there is nothing inherent to the industry that guarantees that if you purchase single mics and you don’t specifically arrange and / or pay for matched mics, you’re getting a matched pair. This is why matched pairs typically cost more and are available only through high end companies. Because someone has to go to the trouble of hand sorting an matching mics. My recommendation is to work toward having a matched set of measurement mics.

Regarding matched pairs / sets, the same is true of speakers. If you compare two of the same brand and model of speaker made at the same time and they haven’t been modified or repaired, you could expect them to match. Loudspeakers produced by companies with a good reputation are going to be fairly consistent but may change the design over time so there is no guarantee a new one will match an old one. This could be due to a design change, a part that is no longer available, etc.. Consequently your best bet is to buy the amount you need at the same time. In the pro audio industry, an industry standard for many years was the EAW KF850. Many different versions of the KF850 were released and so unless you purchased them all at the same time, there is no telling what is inside the box at a driver / crossover level. If you have known speakers born at the same time and you need to test them, you can use one to test the other. If they match, you can be confident that testing the others will reveal any anomalies. While FFT based transfer functions are ideal for comparing things, the tool is not the ideal tool for testing a loud speaker for mechanical issues.

One of the most important tests that can be performed on a speaker is a simple sweep test using an sine wave audio generator with a variable frequency knob. This sort of test will likely reveal any buzzing or mechanical distortion which could be caused by abused drivers, enclosure air leaks or lose materials inside or outside the enclosure. These are issues that likely would not be found using pink noise and a transfer function. Why? Because the noise itself might mask the issue. When you sweep sine wave from low to high or high to low you’re asking the loudspeaker (drivers & enclosure) to reveal it’s linearity. So before I would spend any real money on a pair or set of speakers, I would want to hear them reproduce some sine wave sweeps before I completed the deal. Then I would bring them home and measurement them both and store the traces. This way I could always verify them at a later date to make sure they’re still functioning as designed.

How to measure and optimize your car stereo – part 2

Last night I finally took my first round of measurements and performed an initial optimization on my Scion XA car stereo. Unfortunately running my laptop on batteries for too long, it died and I lost all my data. This morning I reset the gear and started over. Even though the car stereo appears to have some useful EQ, the options are still rather limited. Maybe someday car stereo manufacturers will just provide multiband parameteric eq and delay for each output and we can truly optimize the system. In the meantime this is what I came to:

As I would when measuring a sound system, I began the process by panning and fading to only one speaker zone. In this case I chose the front left door speaker / tweeter (they are wired together). I took various measurements of just that section of the car stereo including what the high pass filter did.

The high pass filter has the following settings to choose from:
Through (no HP),40,80,100,120,150,200,220.
Here are the results of measuring each one of those:

I performed the same high pass filter measurements with the mic in the rear left passenger position. Here are the results of measuring each of of those:

How to approach the optimization process? I tried a few different ways and none of them provided an ideal result. In theory there should be enough DSP to perform the necessary EQ. The receiver offers bass, middle, treble adjustments that include center frequency, boost / cut and Q (filter width). Unfortunately the frequencies you can choose from don’t correspond with the adjustments I wanted to make. The treble frequency centers start at 10k and go up. I left that flat. The middle frequency center starts at 500hz and goes up. I wish it could down to the 200 / 250 range. That is where the frequency content I don’t want is but I can’t get to it without scooping out too much 500. The bass center frequencies are useful but the Q isn’t flexible enough to make the adjustments I wanted to make.

Harmony Fellowship – stage monitors

Today I returned to Harmony Fellowship to add a Yamaha YDP-2001 parametric EQ to the system to process the stage monitors. The venue has (2) Yamaha SM12V wedges linked together on AUX 1 & a newly acquired Rockville self powered 15″ / horn wedge on AUX 2.

My first measurements were to verify that the two Yamaha SM12V wedges matched each other. They do.
Yamaha wedge comparison

Yamaha Club V series
Specs for the Yamaha SM12V & 15″ sibling:
Yamaha SM12V specs

Having verified that the Yamaha wedges match, I unplugged one of them so I would be measuring only one of the speakers. I took another measurement without any eq as my reference point and began adjusting the new parametric EQ to smooth out the response of the SM12V wedge. Here is an overlay of the before and after frequency response traces.
Yamaha wedge pre and post EQ

The SM12V is an affordable floor wedge that measures relatively flat for a 2 way passive design. The one thing I dislike about the SM12V design is how the 40 x 90 horn is turned with the 90 degree side in the vertical plane. Having a 40 degree pattern horizontally in some cases is a good thing but I can’t think of a single reason to have 90 degrees of vertical coverage for a stage monitor. In that configuration you’re covering both your knees and the ceiling. Even so there is some logic behind this design decision. It limits the height of the cabinet (what Yamaha calls low profile) and if the SM12V wedge is used as a main speaker on a speaker stand (which the design allows for), the 90 degree side of the horn is horizontal. What is being sold as a floor wedge in a series of speakers has been optimized for use as a main speaker on a pole.
Yamaha SM12V

For a tight patterned floor wedge I would prefer a symmetric horn (40 x 40). One such design is the Meyer Sound UM-1P with it’s 45 x 45 horn. A fantastic sounding stage monitor.
Meyer Sound – UM1P

Having satisfied my desire to tweak the SM12V eq, I moved on to the Rockville RSM15a wedge.

Rockville Audio – RSM15a self powered 15″ wedge

This self powered cabinet provides a 3 band eq as well as a feedback filter sweep on the side of the cabinet. Here is a photo of the control panel taken from the website.
Rockville  RSM15a control panel

The house audio engineer was thoughtful enough to made sure that the various controls on the cabinet were zeroed out before I began to measure it. Our settings were LINE IN, all 3 bands of EQ set for flat, feedback filter disengaged and volume at unity. One would hope that a self powered cabinet with it’s onboard EQ set to flat would measurement relatively flat but no. The design has some undesirable attributes out of the box.
Rockville pre and post EQ
Note the 15db to 18db of extra 2k and 4k. Not something anyone wants unless feedback is the goal. Consequently, it took most of the available filters to tame the response of that box. It’s possible that using the onboard eq it would be possible to flatten out the peaks but I wanted the house audio engineer to know that the wedge is tuned when the onboard controls are all set to unity.

In conclusion, certainly in smaller rooms, stage monitors have just as much affect on the “sound” the audience hears as the main speakers. They are acting together to fill the room with sound. It would be silly to go to the trouble of tuning the main speakers but leave the stage monitors un-eqed. All speakers in a room should be optimized in their active configuration for that venue.

miniDSP – audio DSP for the masses?

For the longest time the market didn’t offer much in the multi channel DSP market. There were $1000+ 2×6 and then 4×8 units that were $3000+. Recently that situation has changed which is good for those of us who want separate control of each speaker in a sound system. Anytime you link speakers together (either at the amp or at the DSP output) you’re giving up the ability to mute, control and optimize each speaker. How does one do a system component check if you can only mute / unmute a group of speakers?

minidsp has a few offerings that allow for some interesting possibilities when it comes to home and even professional speaker processing.

miniDSP 2×4

miniDSP 4×10 HD

miniDSP 10x10HD

Each unit requires a software plugin to allow it to function. Fortunately the plugins are inexpensive and provide a lot of processing functionality.

Behringer ECM8000 warning from Cross Spectrum Labs

I found this information on a 3rd party mic verification and calibration tester called Cross Spectrum Labs regarding the Behringer ECM8000. BUYER BEWARE!!!

cross-spectrum.com – Calibrated Behringer ECM8000 microphones

QUOTE:

Effective immediately, Cross·Spectrum has ceased selling calibrated Behringer ECM8000 microphones. The quality of ECM8000 microphones has deteriorated to the point that we can no longer justify the effort in dealing with non-functioning units or mics with extremely abnormal frequency responses.

BUYER BEWARE!!!

If the reason you are going to use a measurement mic is to make accurate measurements, what good will an inferior mic do to reach that goal? Consider one of the other inexpensive mics on the market with a better track record. For example, Cross Spectrum Labs will verify and calibrate a Dayton EMM-6 microphone.

cross-spectrum.com – Calibrated Dayton EMM-6 microphones

QUOTE:

Calibrated Dayton EMM-6 microphones

We are now selling calibrated Dayton Audio EMM-6 measurement microphones on an ongoing basis.

These microphones are similar (but not identical as you may read on some forums) to the Behringer ECM8000 and the stock units come with on-axis calibration curves.

We provide the following value-added services over the stock Dayton EMM-6 microphones:

The calibration curve provided by Dayton is in the range of 20 Hz to 20 kHz. We provide calibration files (.FRD format) on a USB thumbdrive for use in many popular audio measurement programs. Additionally, our cal files range from 5 Hz to 25 kHz to encompass the low bass and high treble regions that many audiophiles, professionals and home theater aficionados require.

Our own microphone measurements indicate that the data sheets included with the mics may not be representative of the EMM-6’s individual performance. As shown in the second link, our measurement methodology compares favorably with the results generated by a NVLAP NIST-traceable laboratory so you can be confident that your data are reliable.

As with our calibrated ECM8000 microphones, each EMM-6 microphone is calibrated against an ANSI-certified reference microphone. Each microphone will be shipped with the following:

Dayton Audio EMM-6 microphone with windscreen, case, and microphone clip
Microphone characterization report ( “Basic+” sample/ “Premium+” sample) with individually measured on-axis (0°) frequency response
“Premium” calibrated microphones will also include polar response, sensitivity, and noise floor
“Basic-Plus” and “Premium-Plus” microphones include frequency response curves at 45° and 90° angles of incidence
USB thumbdrive with frequency response data (.FRD format) and polar response data (Excel and .CSV formats, “Premium” calibrated microphones only)

Prices start at $75 plus shipping for “Basic+” calibrated microphones. Click the “Pricing” tab for information on domestic and international shipping rates.

Dayton EMM-6 with Cross Spectrum Labs calibration comparison

This is an interesting comparison between and Earthworks M30 and a Dayton EMM-6 that has a calibration file provided by 3rd party tester Cross Spectrum Labs.

hifizine.com – Dayton EMM-6 measurement microphone, calibrated by Cross-Spectrum Labs

Interested in having a mic tested and being provided with a frequency and polar chart as well as calibration files?

Cross Spectrum Labs website

Here is an interesting thread that appears to include comments by Cross Spectrum Labs staff regarding Dayton factory calibration files:

hometheatershack.com – Re:Cross-Spectrum Microphone Calibration Service – USA

Horizontal & Vertical planes

Part of the language of sound system design and optimization has to do with horizontal and vertical planes. What do those terms actually mean?

First let’s visit WIKI:

WIKI – Horizontal plane

WIKI – Vertical plane

WIKI – Horizontal and vertical

Now let’s get into how these concepts relate to sound localization which refers to a listener’s ability to identify the location or orgin of a detected sound in a direction and distance.

WIKI – Sound localization

Now let’s move to the concept of interaural time difference or ITD which has to do with the difference in arrival time of a sound between two ears:
WIKI – Interaural time difference / ITD

FAR – Forward Aspect Ratio

How does one figure out the proper speaker to use for a given design goal?

In Bob McCarthy’s book “Sound Systems – Design and Optimization” on pages 240 through 247 – 2nd edition he explains the concept of FAR (forward aspect ratio).

Saint Andrews part 5

Last night I finally had a break through on this design. The issue has always been that the space is used in two different configurations. With and without a live band. If the design covers all the seating, it will also cover the band when the band is present. Using Google SketchUp, I did a study of a design that will cover all the seats and and a different design that doesn’t cover where the band sets up (mirrored on the opposite side of the venue). One design uses (3) speakers and one design uses (4). The solution (whether it’s the chosen design or not) is a design that has (2) parts to it. The (4) speakers will provide coverage to all seating for general voice (lectern, altar & any wireless mics) while the other (3) speakers will amplify the band instruments while leaving them out of the coverage pattern. This would be considered an A/B sort of design and there are sonic benefits to be had in having only voice is one set of speakers and the band in another set.

The biggest downside I see to this design concept is that it will require more gear (speakers, amps, dsp). There is a chance that having the band located in the coverage zone of the (4) speaker system won’t be an issue so it’s logical to start with the (4) speaker design and add 3 additional full range speakers if necessary.

My original designs were based around Meyer Sound products but the budget for this project doesn’t afford using Meyer gear. Instead I’ve adjusted the design to take advantage of some QSC speakers. Specifically the AD-S12 full range box and the AD-S112SW sub woofer. Both can be mounted on a yoke which simplifies rigging.

Here is a top view of the (4) speaker design that covers all the seating:
St Andrews top view 010916 4 zones with arcs

This is a mock up of what the design might look like installed.
Saint Andrews 4 speaker mockup

Here is a top view of the (3) speaker design that leaves the band area uncovered:
St Andrews top view 010916 3 zones with arcs

Here is a top view of the (7) speakers which would function at the same time but not reproducing the same signals. Voice would go to the (4) main speakers and the band channels would be routed to the (3) band speakers:
St Andrews top view 010916 7 zones with arcs

This is a mock up of what the design might look like installed:

Saint Andrews 7 speaker mockup

Here is a side view to learn if the 75 degree coverage pattern is going to work or not.
St Andrews side view angles 010916
From the side view, it appears that 75 degrees of vertical coverage is going to provide too much coverage but the locations where the floor and back wall intersect with the coverage pattern are at the edges where we can expect to be 6db below the on axis response. Also the back wall is mostly absorptive because it’s the facade hiding the pipe organ which is made of soft material and open wooden framing. 75 degrees speaker will be a huge improvement compared with the existing overhead ceiling speakers.

Ignorance Is NOT Bliss

A thought for 2016. Ignorance is NOT bliss or else I’d be pretty happy at this point.

The more I learn about the acoustic measurement process and system design and optimization, the more I realize how much more I need to understand to be competent. After years of active study, what I’ve become good at is recognizing my blind spots. This can be discouraging but I knew starting this adventure that it wasn’t going to be easy. The tools themselves are now well understood. Now it’s time to get more comfortable with the various procedural routines. This is something that 6o6 McCarthy spends a great deal of time on in his classes but for which I still struggle with. It all seems so simple until I’m standing there with my mics and someone’s system is on the line. The map (if you will) of how you get from point A to point Z in the optimization process is known. Proper system design and optimization must follow a certain set of steps in the proper order or else all the decisions made along the way are invalid. 6o6’s book, “Sound Systems – Design and Optimization” goes into great detail regarding these steps but in some ways the details are overly & yet necessarily complicated. Sometimes it’s helpful to be able to ask a question and get an answer. Having mentors has greatly expanded my knowledge. Thank you to everyone who has texted, emailed and called when I get lost in the gory details…

Acoustic Measurement and Predictive Modeling – roundtable

This is an interesting article that asks various questions of some big names in the industry:

QUOTE:

For answers, Sound and Video Contractor assembled a panel of authorities in the field, drawing representatives from a cross-section of users and manufacturer/developers. Those experts include Wolfgang Ahnert (principal, ADA Acoustical Design), Jamie Anderson (product manager, SIA Software, a division of Loud Technologies), Pat Brown (president, Synergetic Audio Concepts), Bengt-Inge Dalenbäck (owner and software developer, CATT-Acoustic), Kevin Day (senior consultant, Wrightson, Johnson, Haddon & Williams), David Kahn (principal consultant, Acoustic Dimensions), Ted Leamy (director, engineered sound, JBL Professional), Bob McCarthy (president, Alignment and Design), Perrin Meyer (software R&D manager, Meyer Sound), Roger Schwenke (staff scientist, Meyer Sound), and Robert Scovill (concert sound mixer/producer, Eldon’s Boy Productions).

END QUOTE:

creativeplanetnetwork.com – Acoustic Measurement and Predictive Modeling

The very last response is from Robert Scovill which I think is worth a quote of it’s own:

QUOTE:

Scovill: Again, from the perspective of a mixer, I would love to see FFT and spectral analysis built into the onslaught of coming digital console platforms. It will be an invaluable asset for latency measurements within the desk and input and output stage analysis completely integrated to the package. I’ll take all of that you can give me.

END QUOTE:

Indeed. Once we can compare any two signals at any point in a mixing console, we will be able to do things like phase align the bass DI with the bass mic or the bottom snare mic with the top, etc… Then the optimization process will continue from the sound system right into the performance.

Apple Iphone & Ipod audio output measurements

We’re all listening to music on our phones and some of us are even using our phones to play back music over a PA system (preshow music, sound cues, etc…) I was looking for the output impedance specs of an Iphone and came across this measurement information related to the Iphone.

archimago.blogspot.com – MEASUREMENTS: Apple iPhone 4 & iPhone 6 audio output
kenrockwell.com – Iphone audio quality
stereophile.com – Apple Ipod measurements