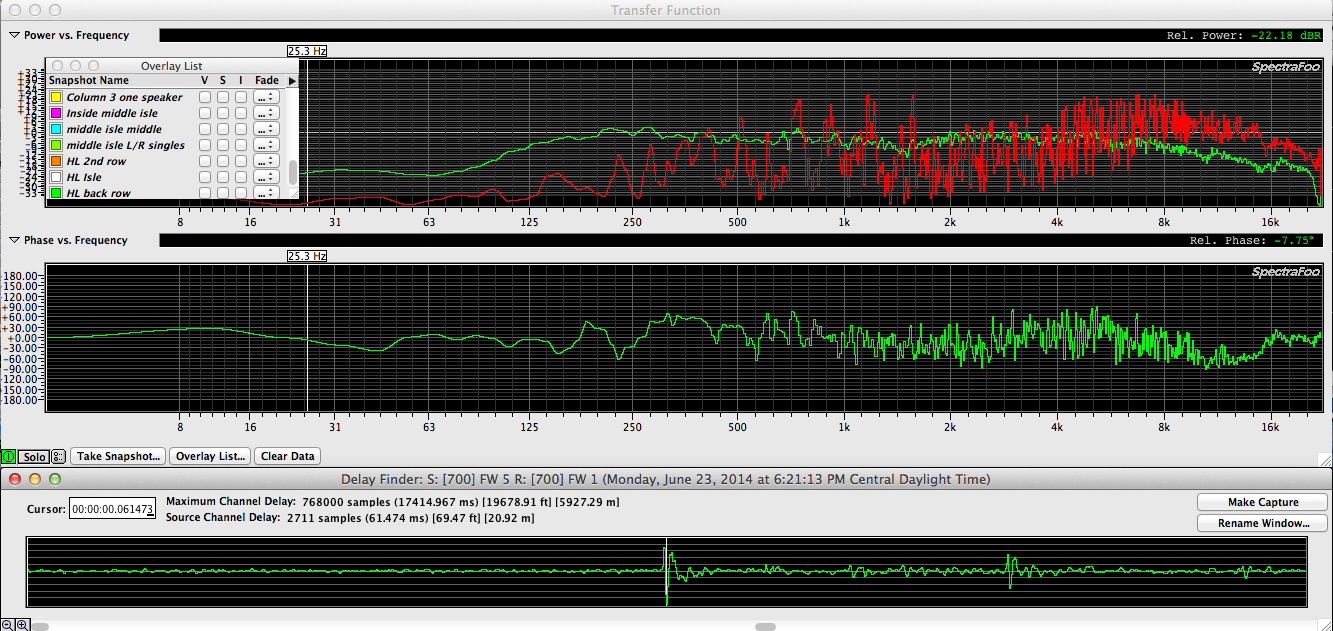
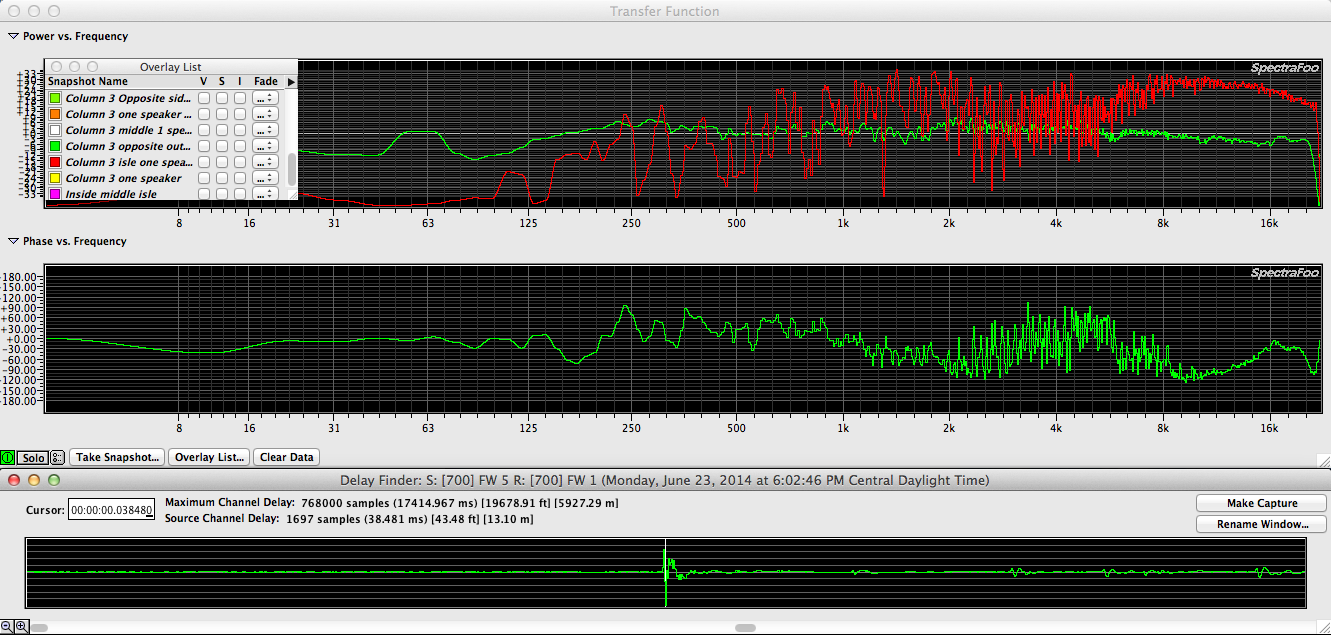
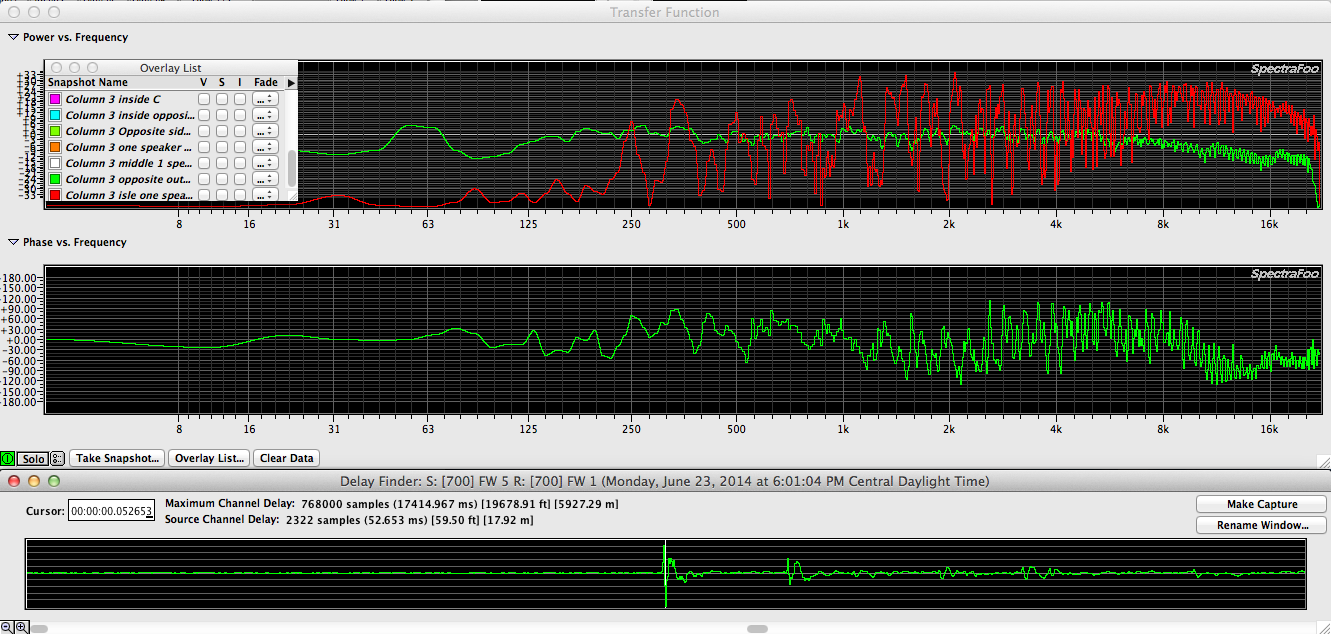
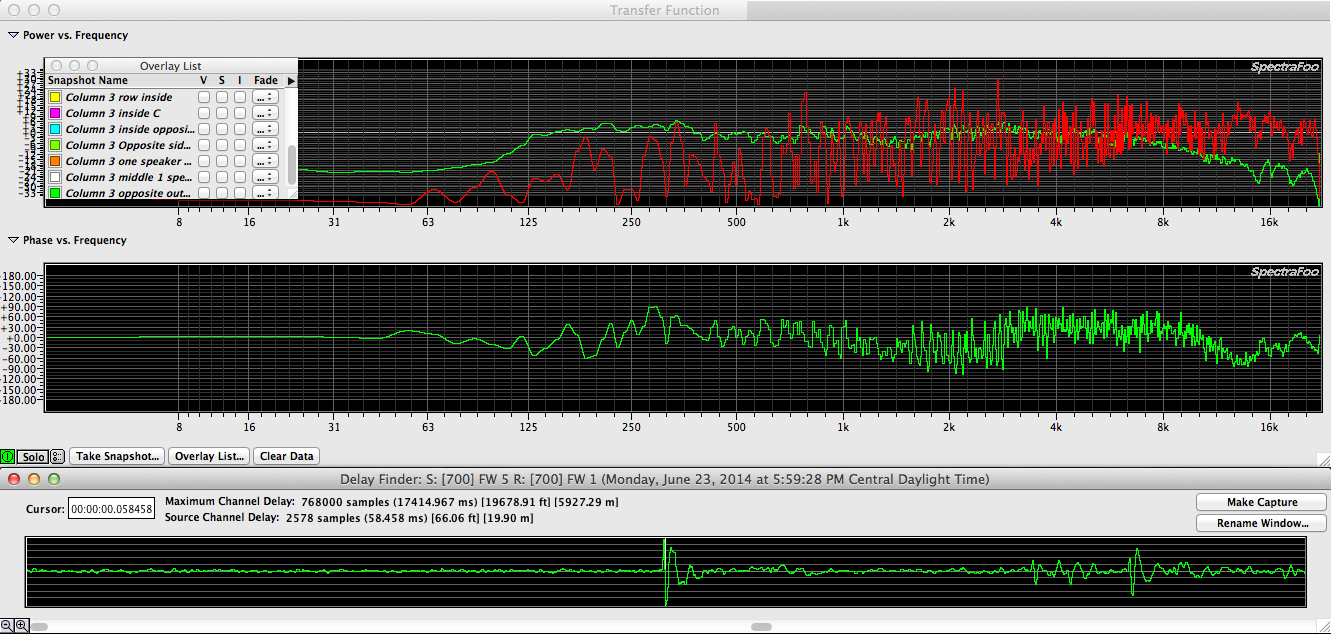
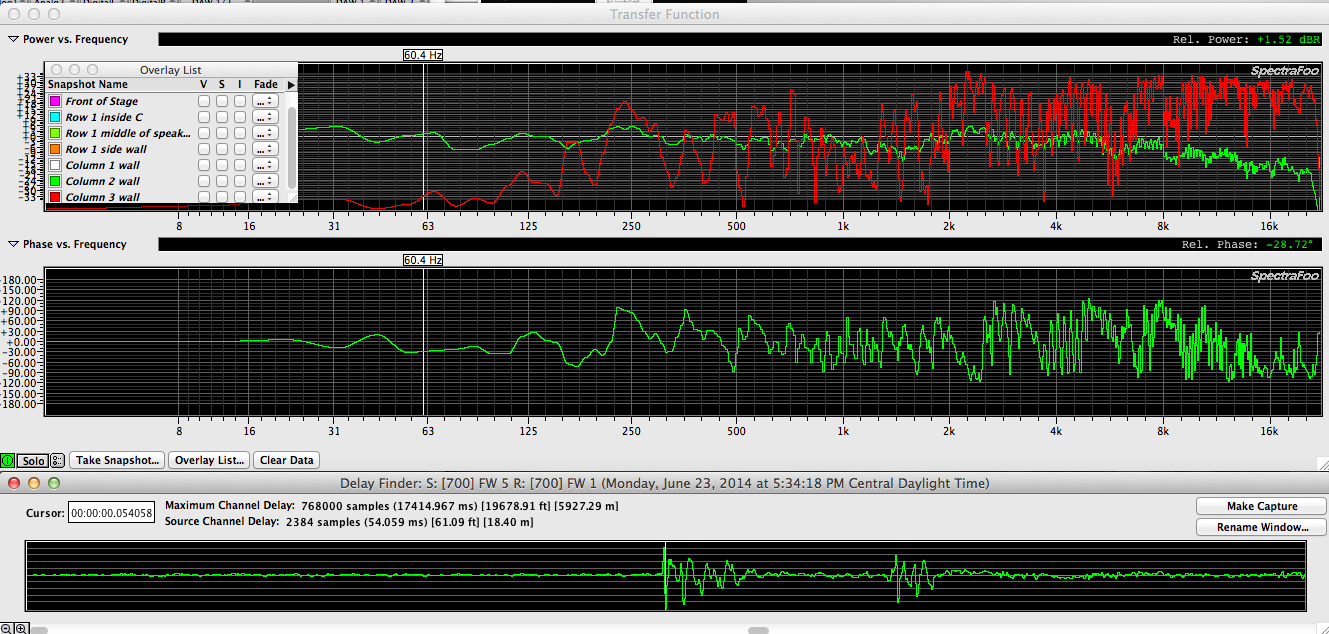
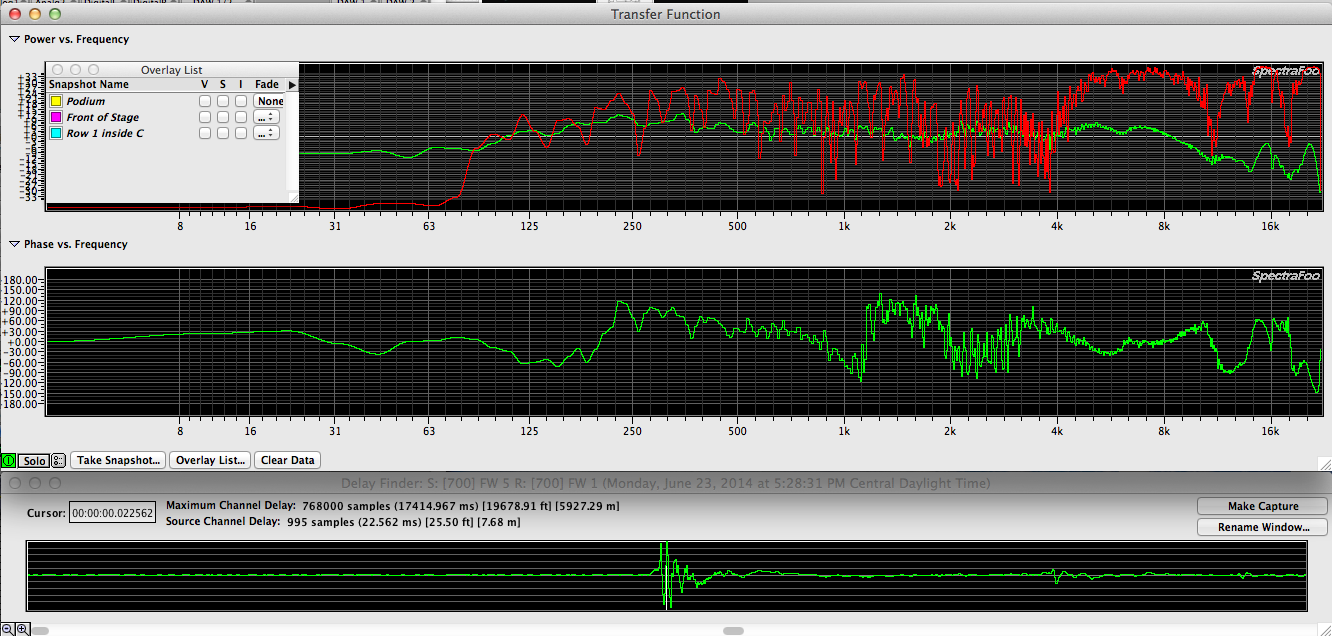
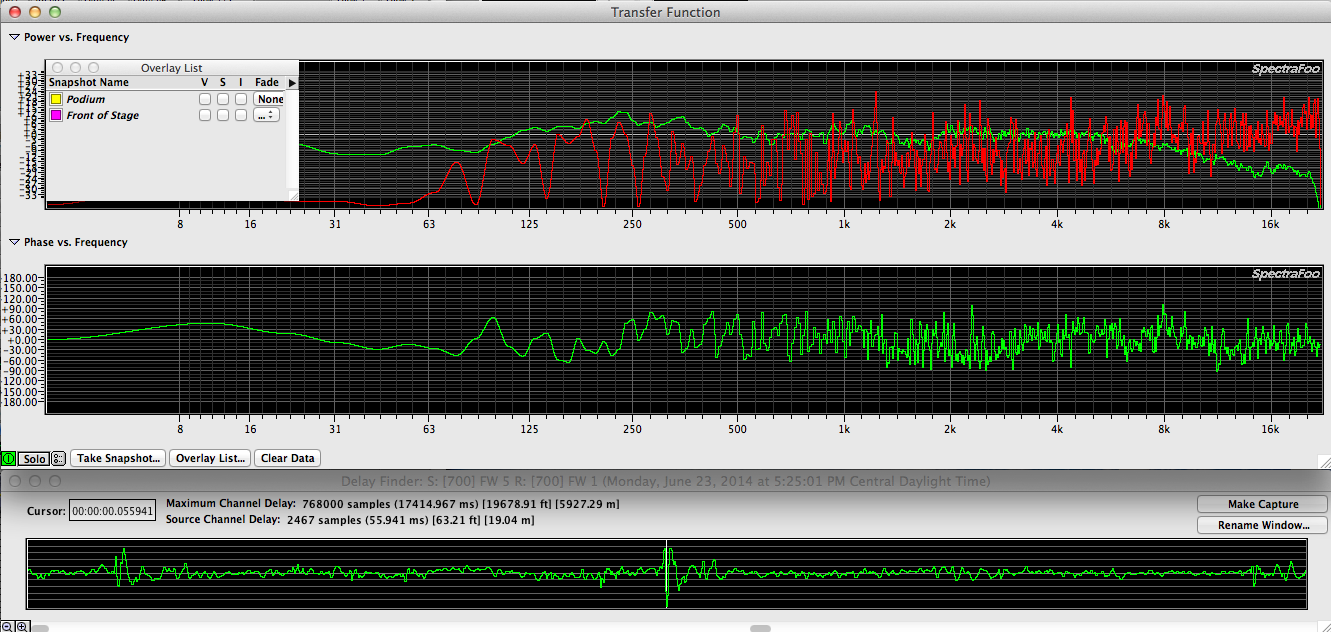
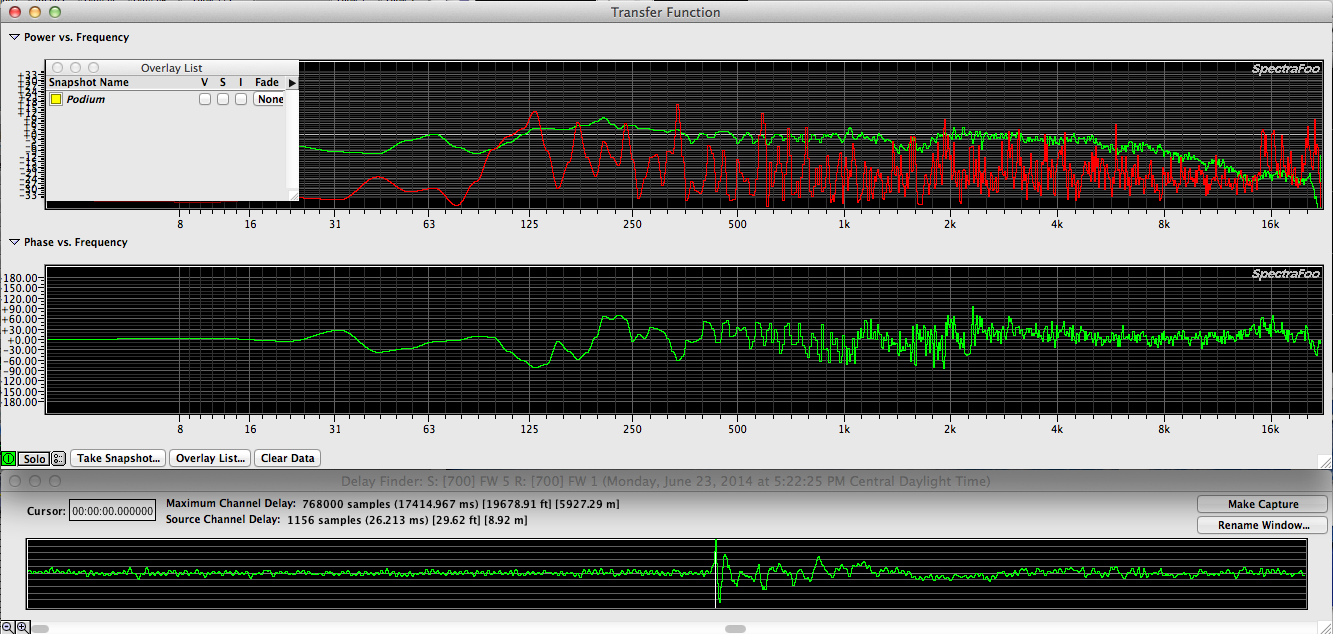
Below are some Spectra Foo Complete transfer function screen captures to illustrate how the (3) different windows available within a transfer function relate to each other.
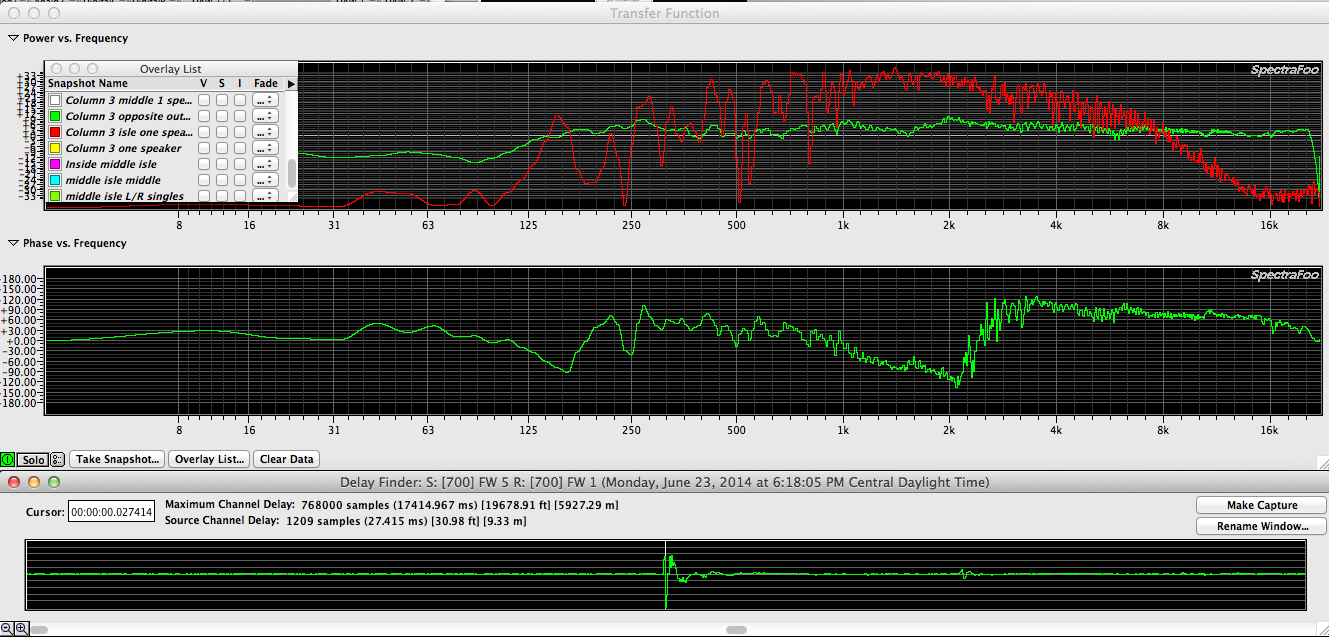
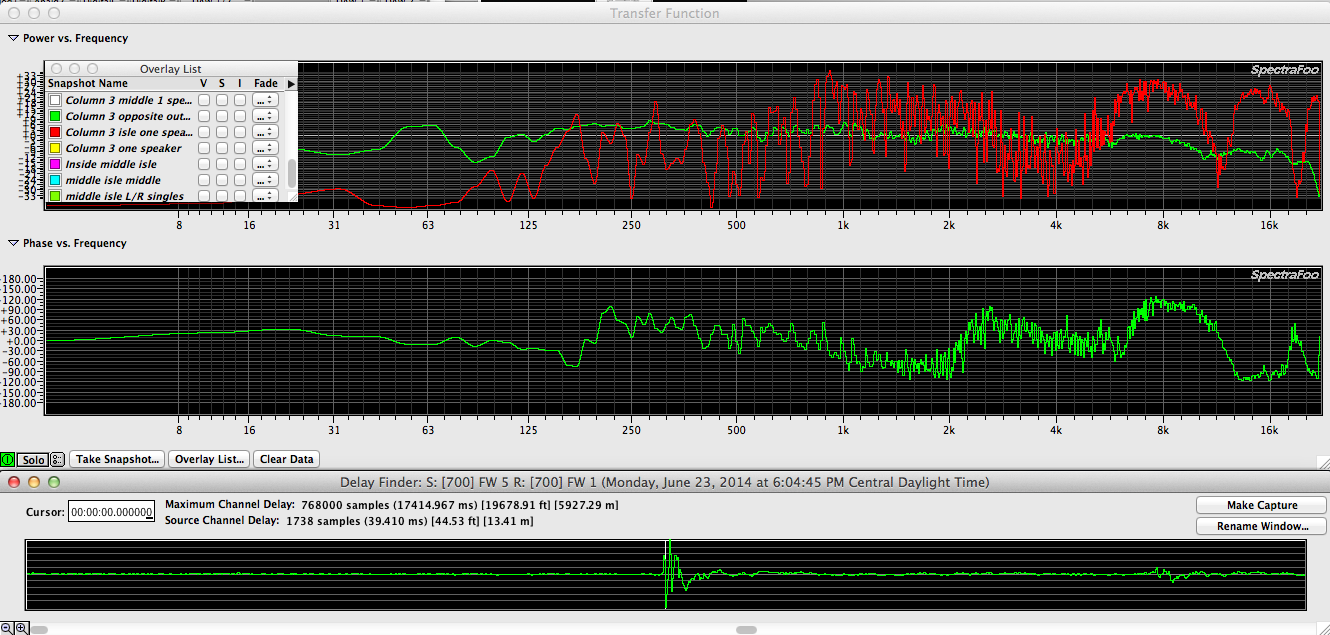
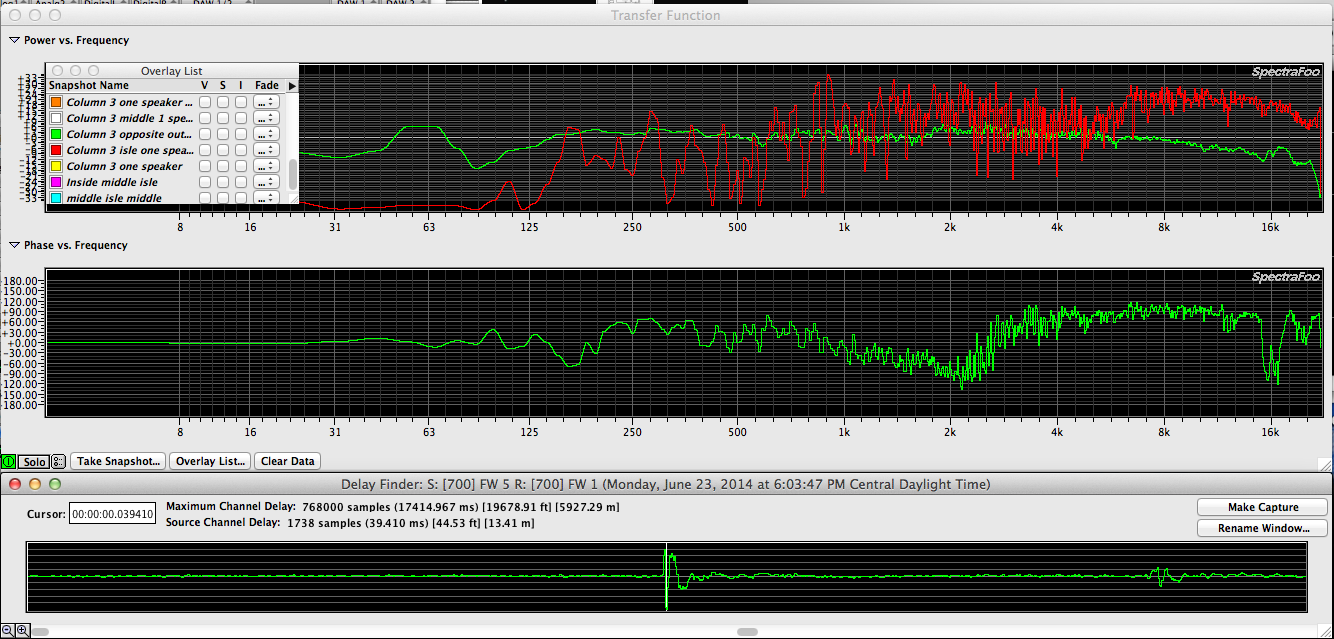
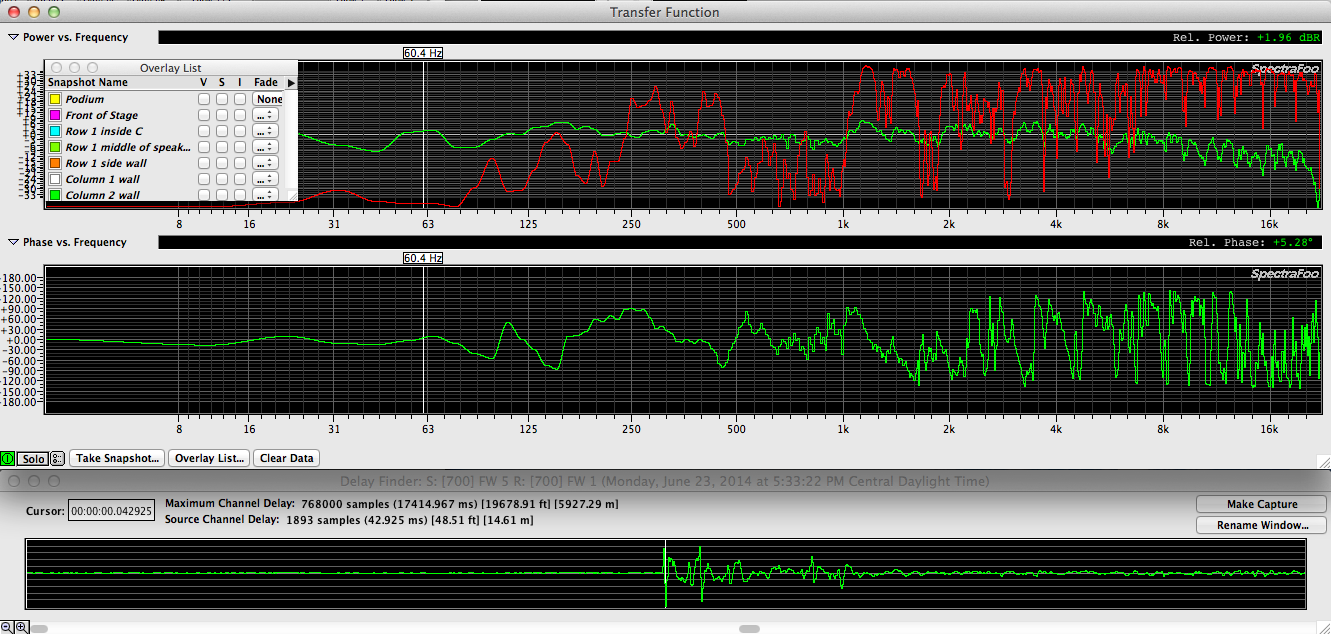
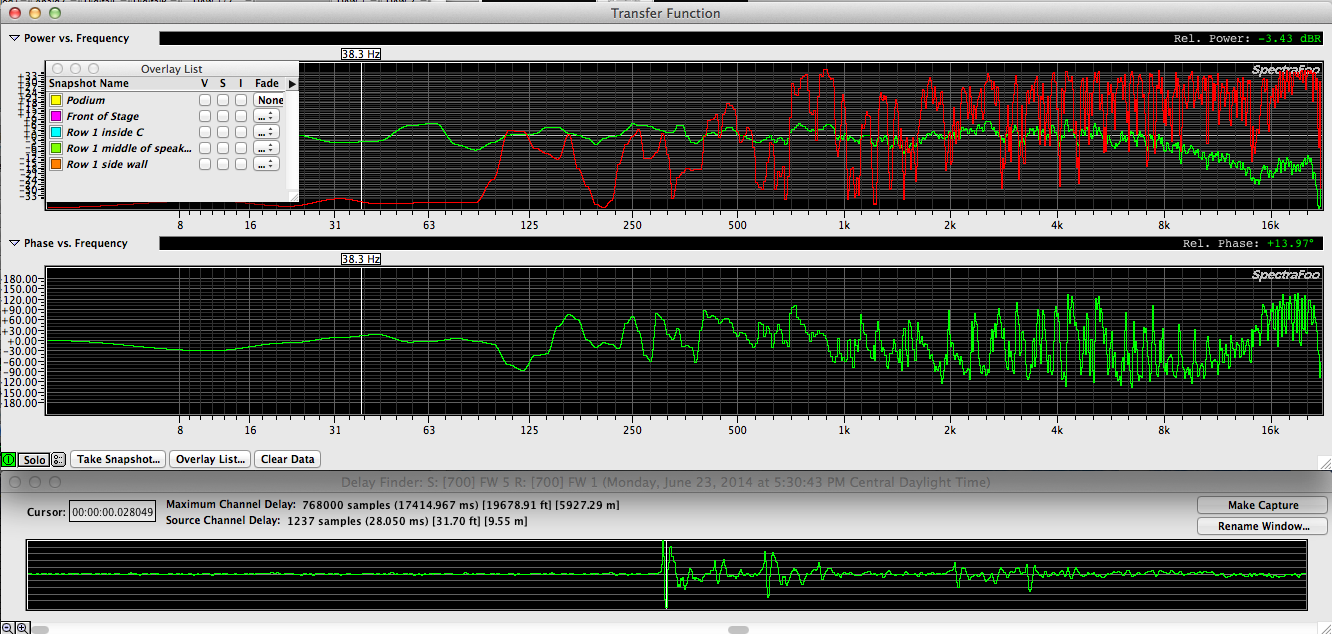
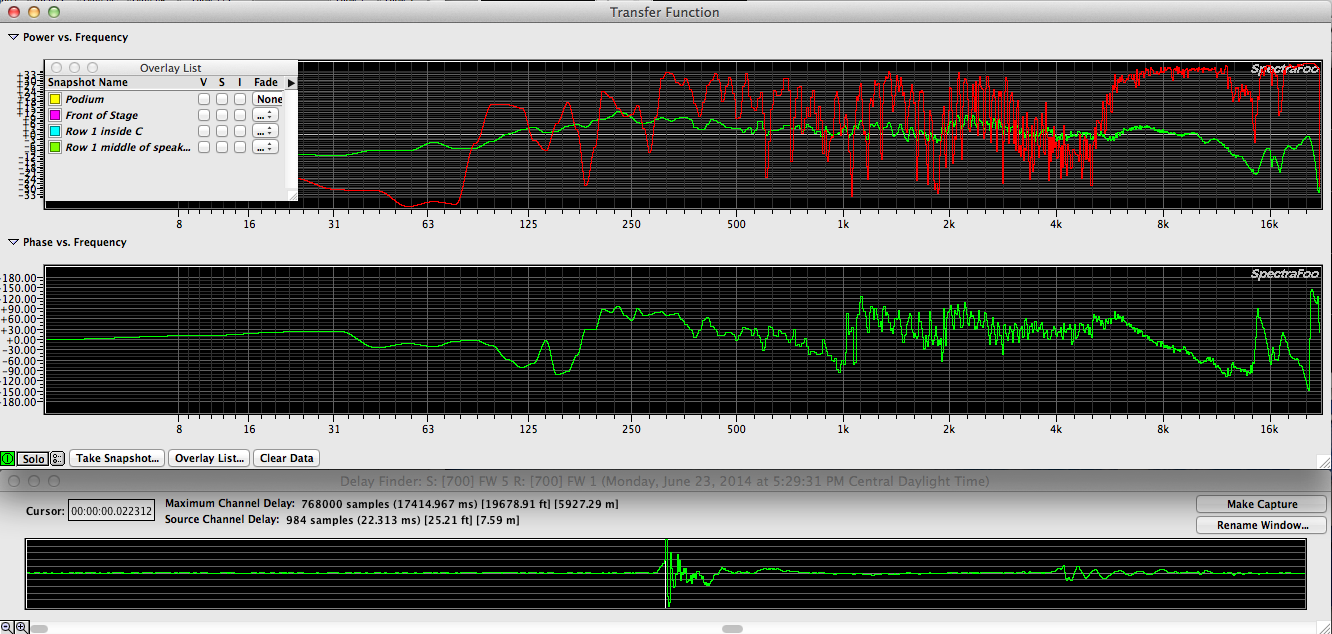
The top window shows frequency response (green) & coherence (red).
The middle window shows the phase response (green).
The bottom window shows the implied impulse response (green).
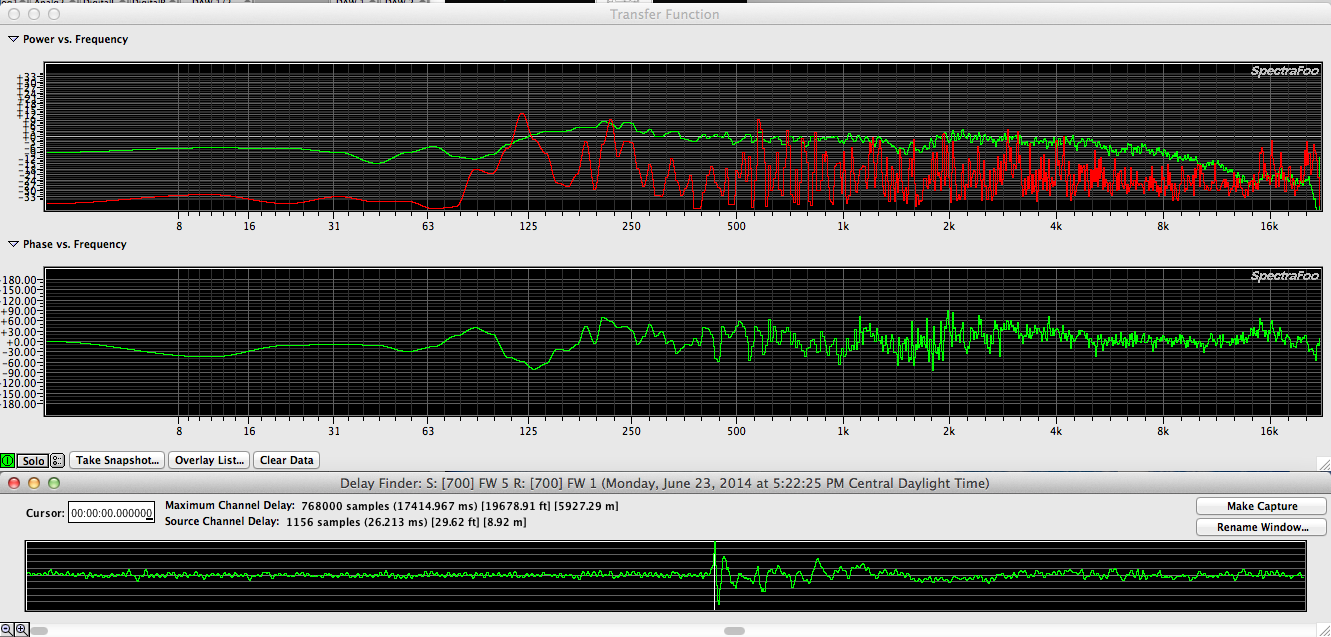
Here is an example of a perfect set of captures. This was made by measuring the internal pink noise generator inside the program against itself.
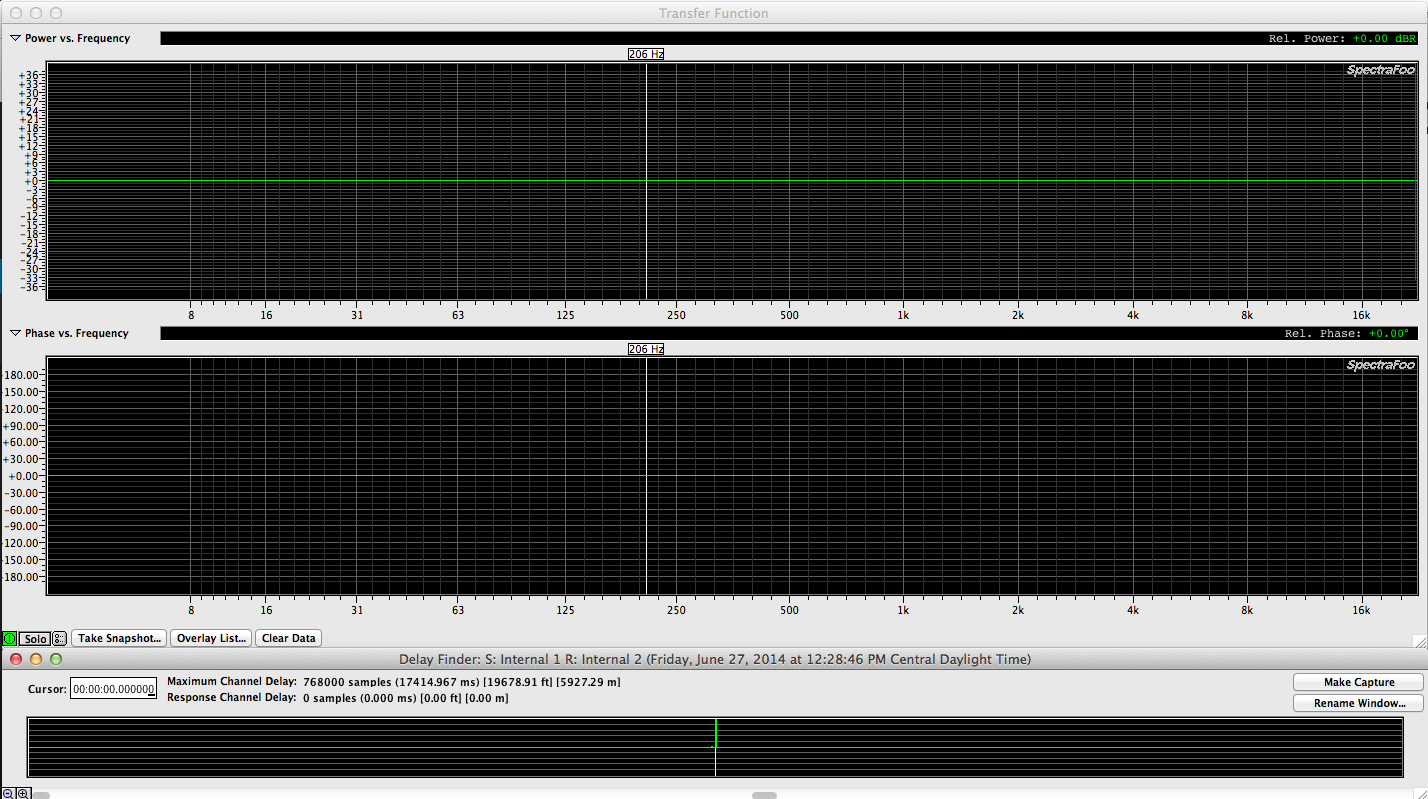
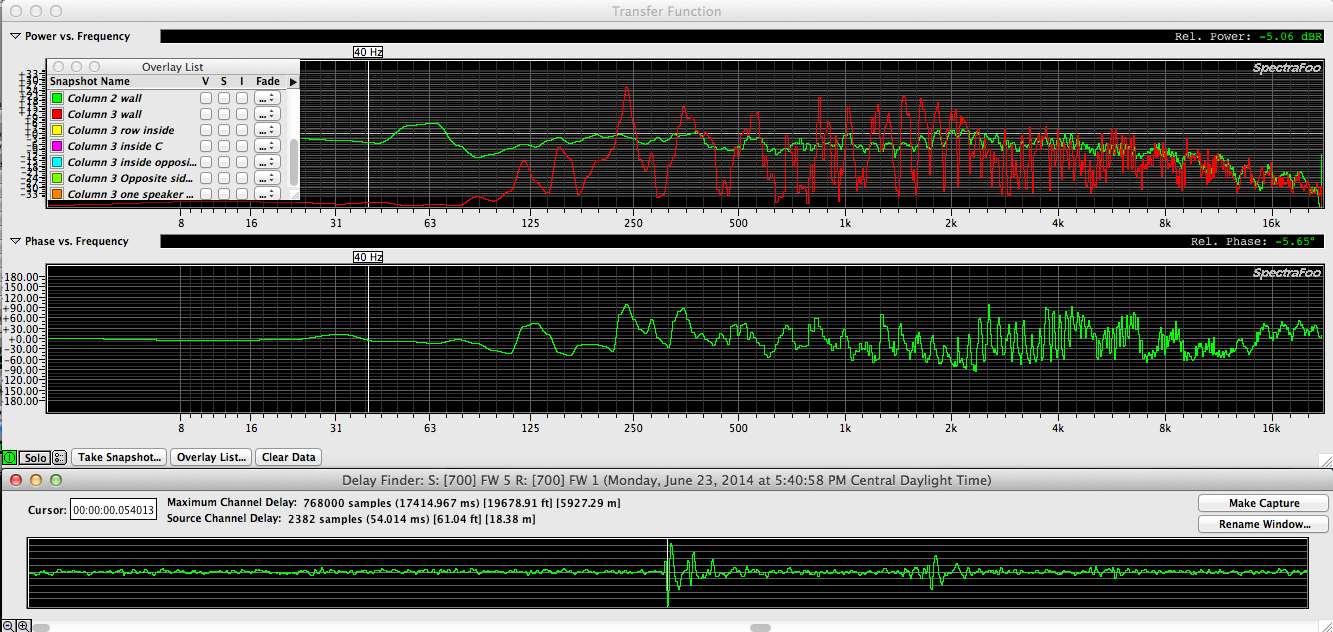
You’ll never see anything like the above screen capture in real life conditions. Instead you will see things like what is shown below.