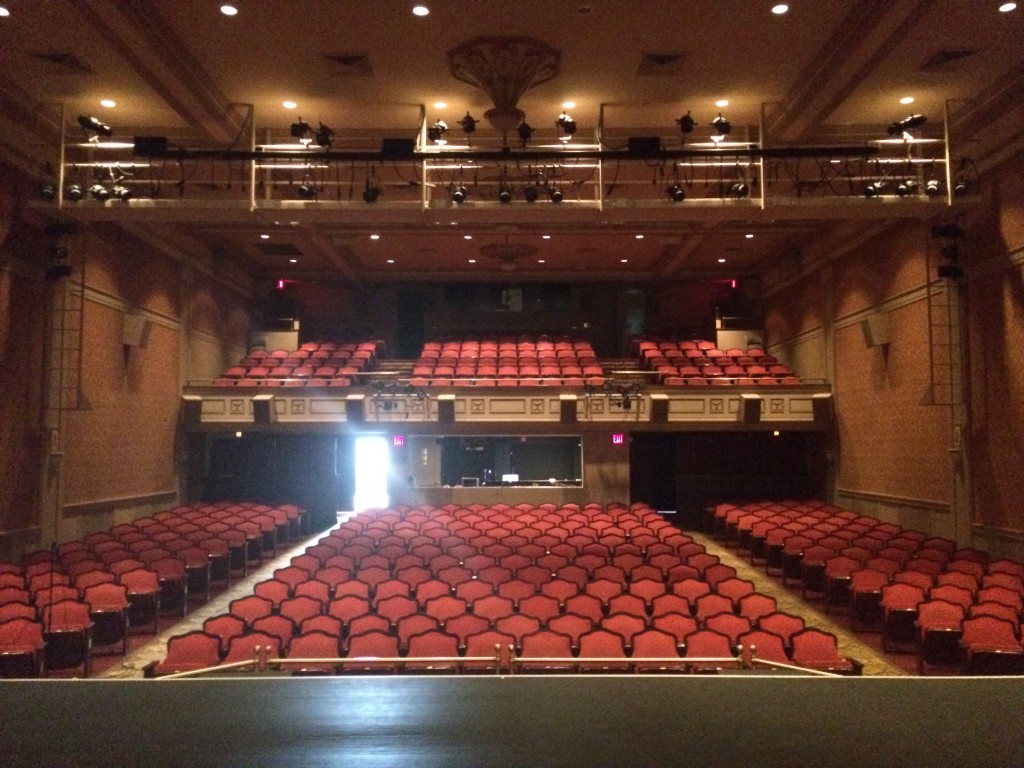
I flew into NY a day early so I would have some time to spend with one of my favorite audio fellows, Jim McKeveny. Jim is the head house audio engineer at the West Hampton Beach Performing Arts Center.
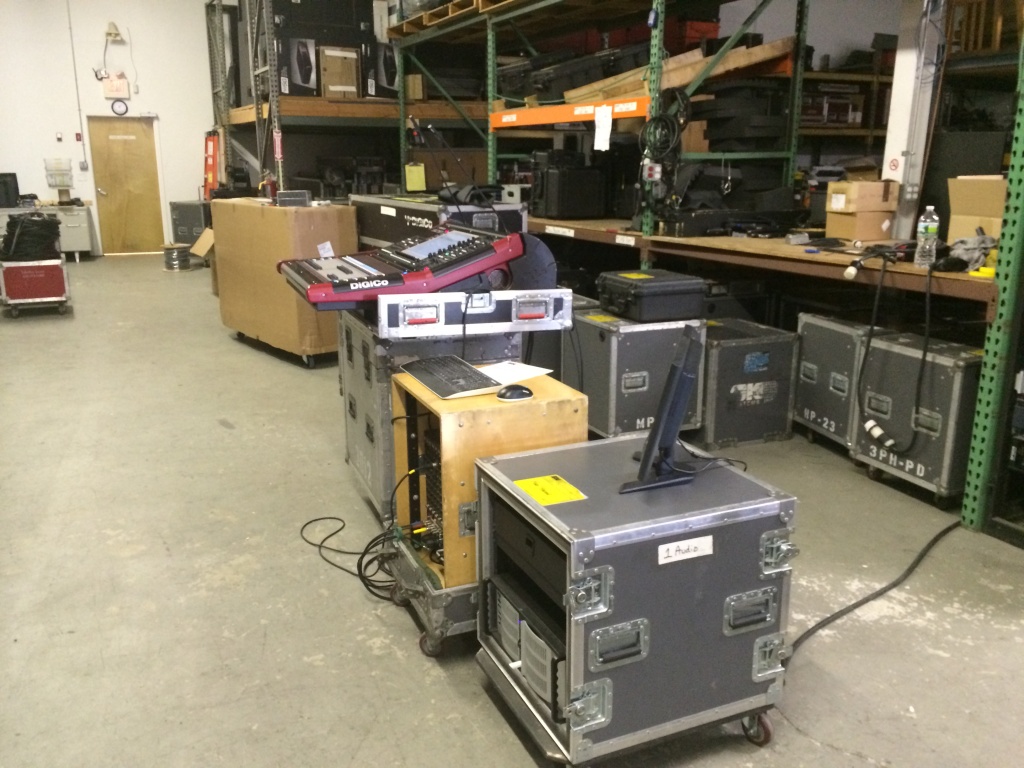
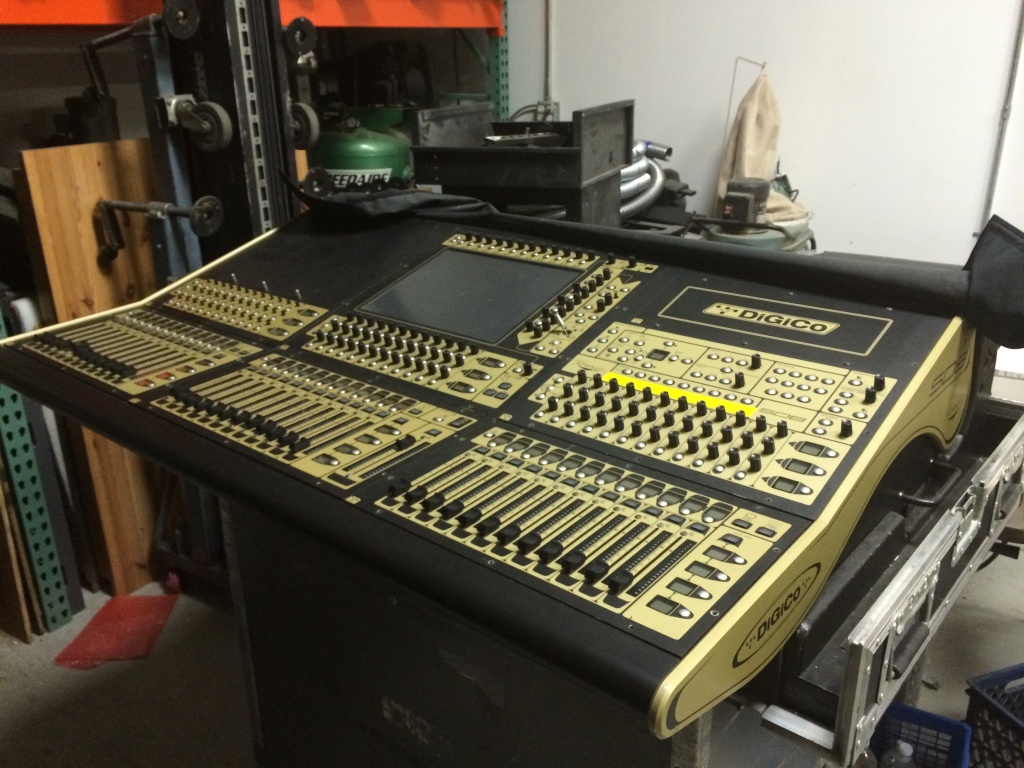
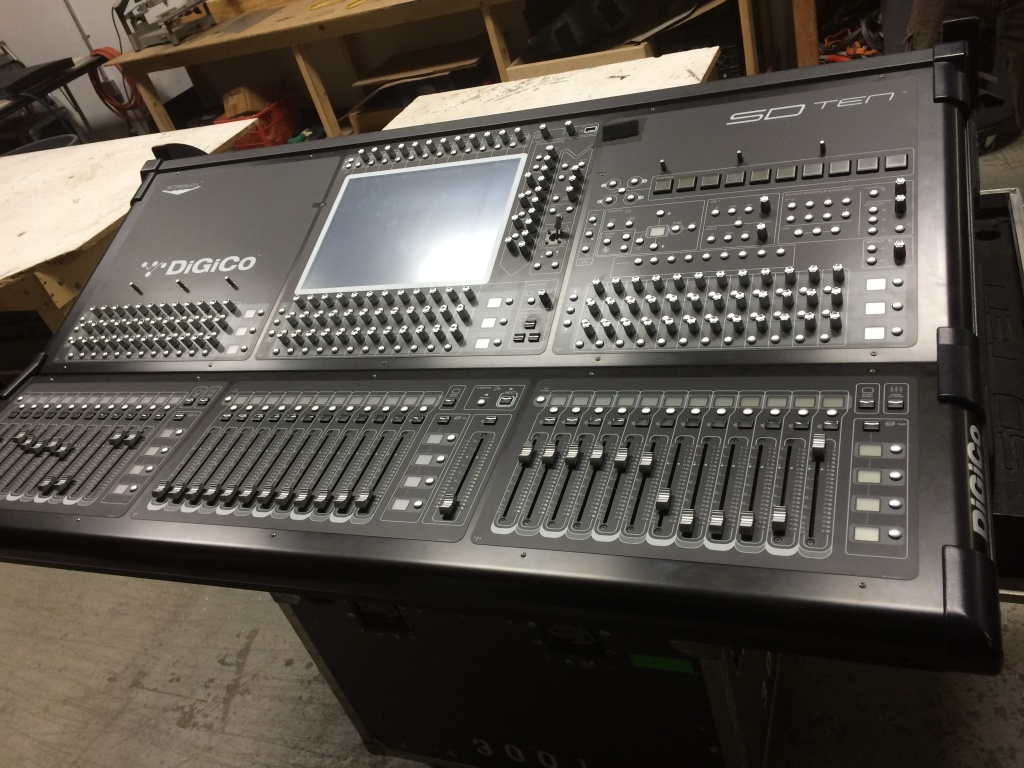
On our way to WHBPAC, we made a visit to SK-Systems, a local pro audio supplier and Digico rental house. SK-Systems is owned by Tom Heinisch (FOH for Indigo Girls, Prince, etc…) who wasn’t around but I got to meet two SK techs, Ben and Keith.
For the show I was working on, we were renting a Digico SD9 console and MADI recording rig from SK Systems and Ben showed me the ins and outs of the MADI recording rig. Very helpful.
While I was at the SK shop I got to look at two Digico SD consoles ruined (at the same time) on a show where a storm surprised the crew. Now delegated for spare parts… 🙁
Note to self…”Always carry plenty of tarps and be ready to cover the expensive gear at the first sign of bad weather!”
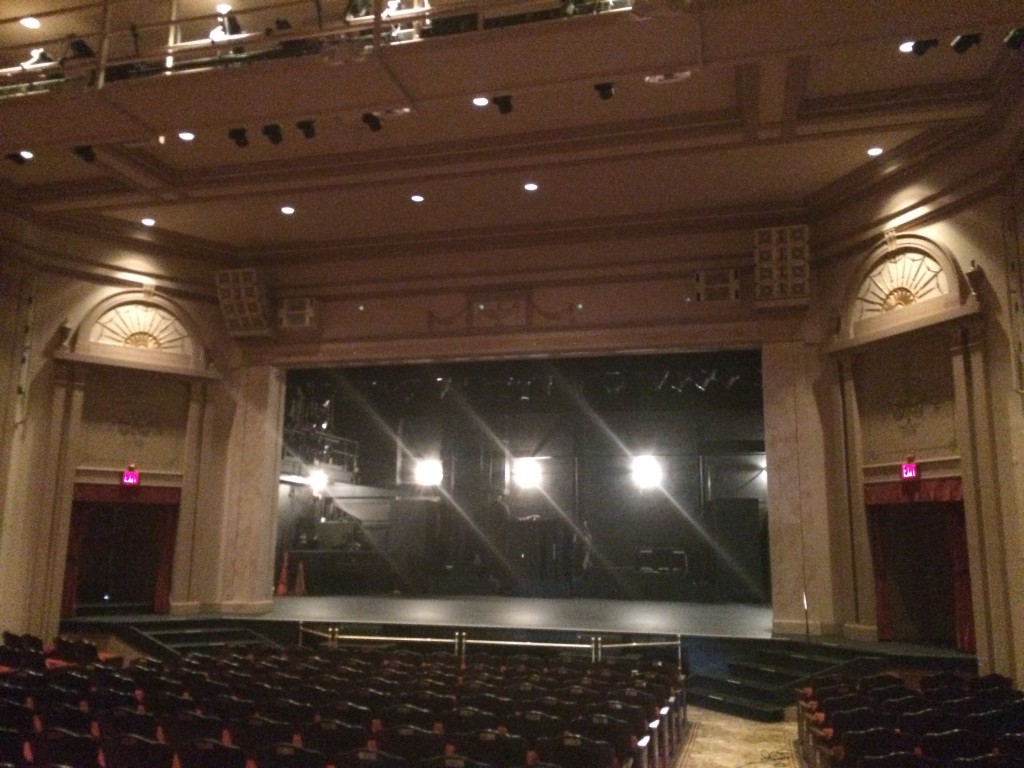
We headed for West Hampton Beach Performing Arts Center.
Here is a link to the venue technical page:
Of special interest to us is the PA specs.
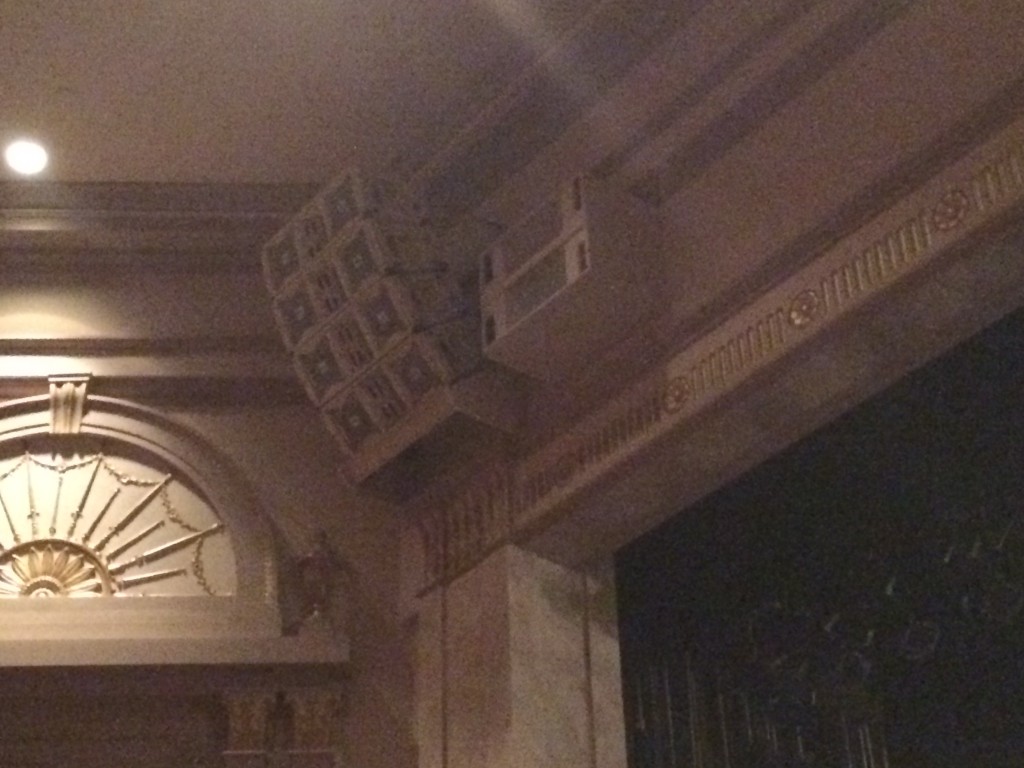
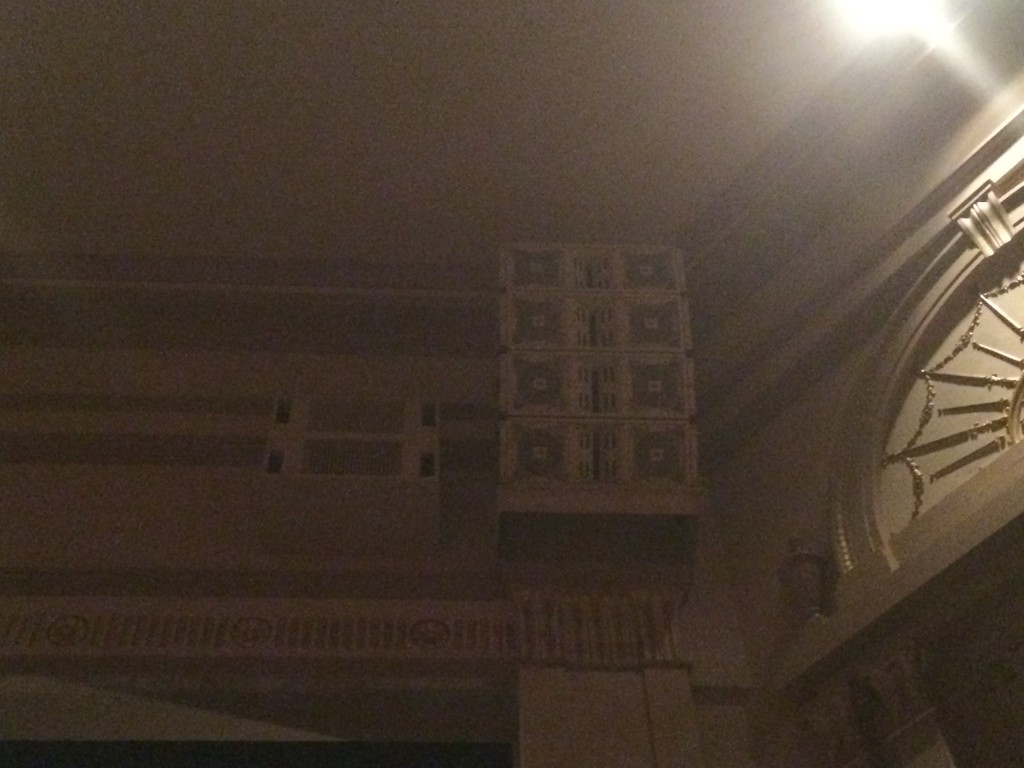
JBL VERTEC VT 4887 FOH line array (4 boxes per side)
2 McCauley dual 15″ Subwoofers (mounted next to arrays on proscenium wall)
2 JBL 2 x 18 CSR82L Subwoofers
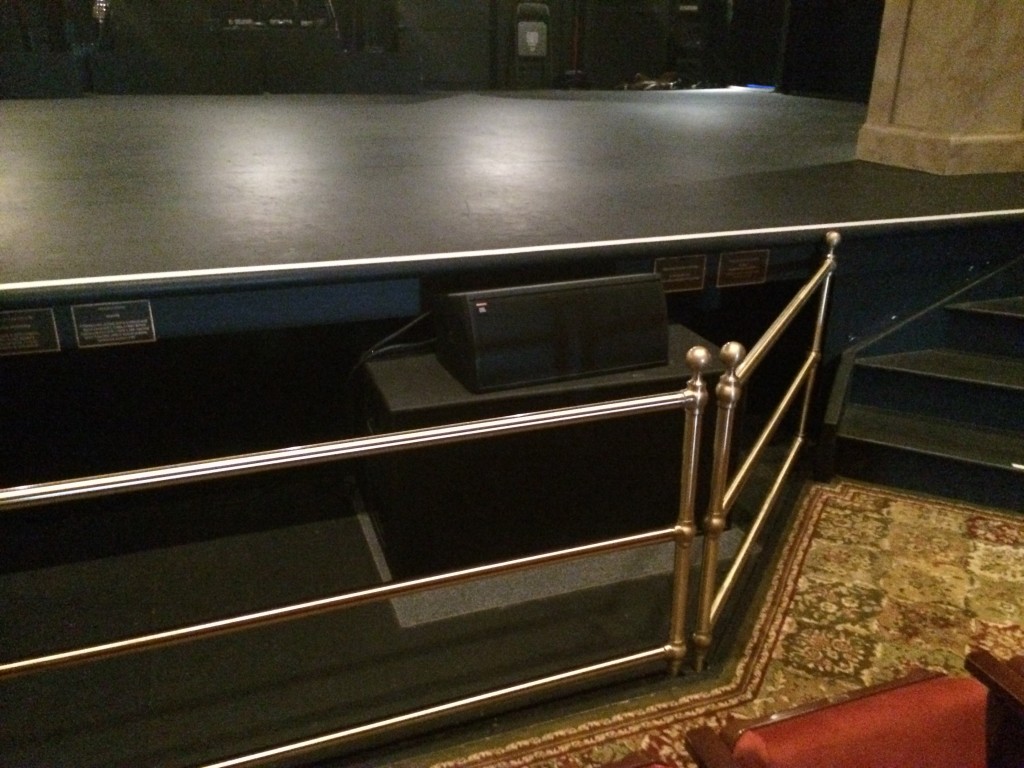
2 JBL MS – 28 Center fills
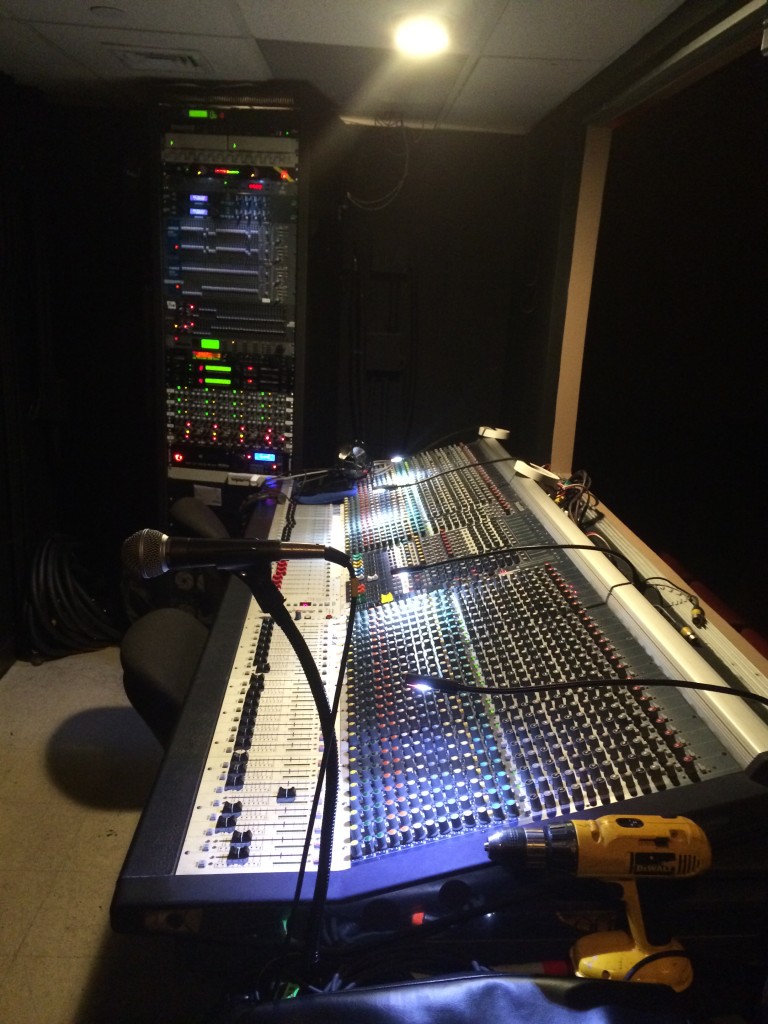
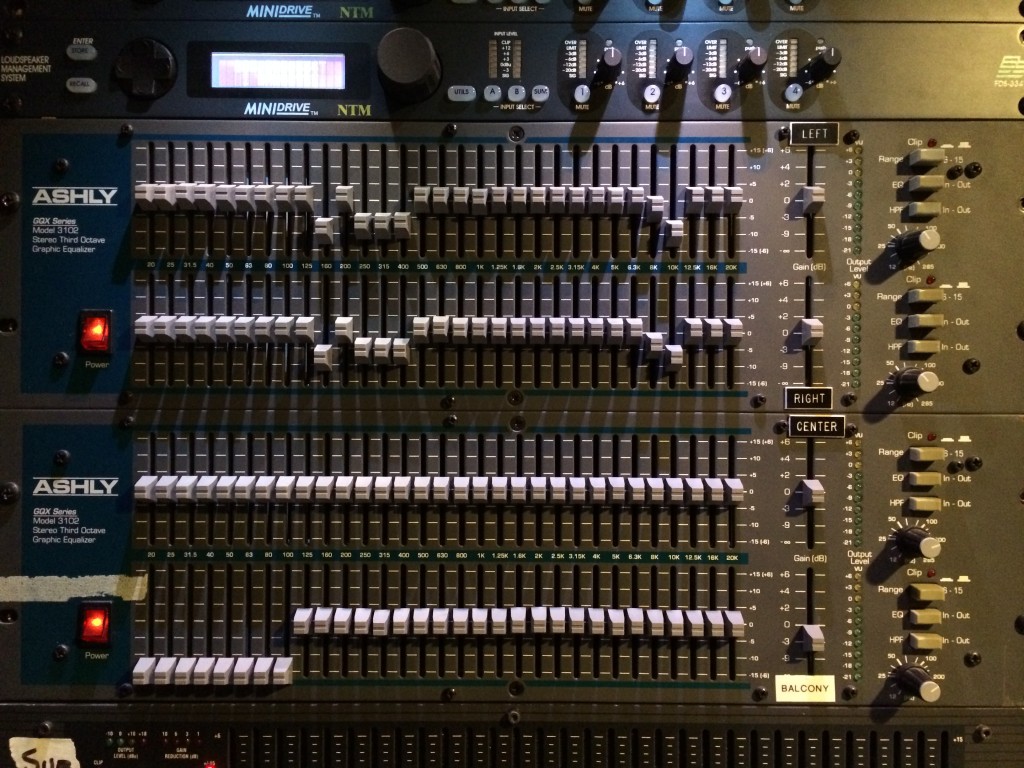
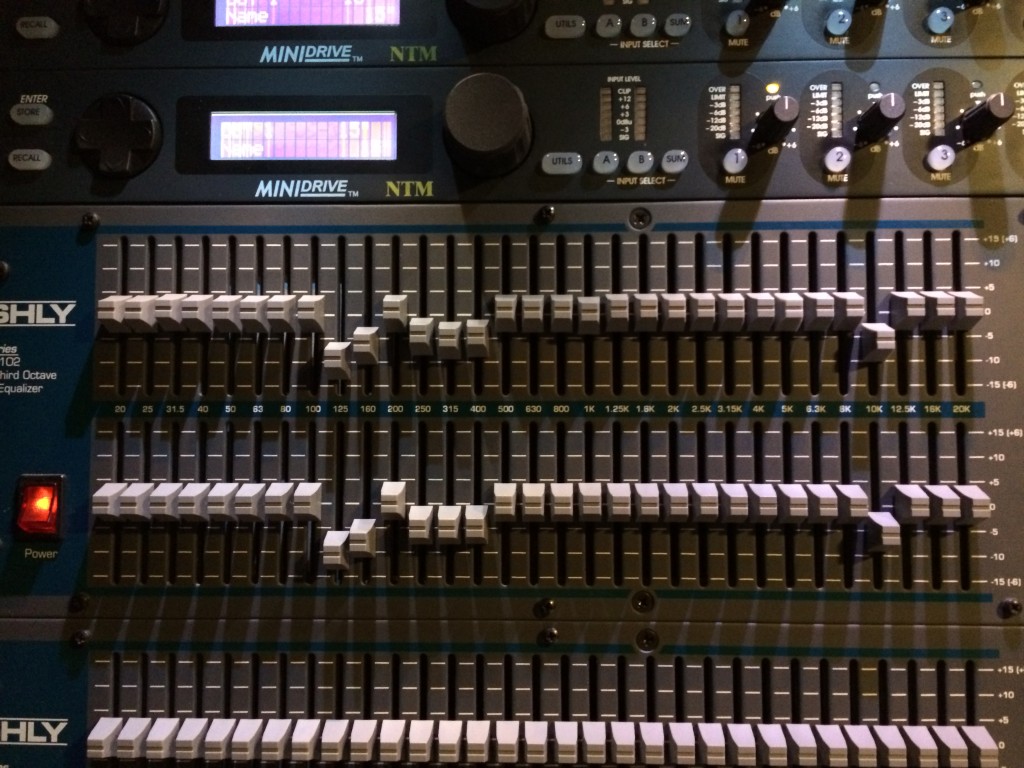
The first thing I noticed when I arrived in the sound booth was a curve on the house Ashly graphic EQs.
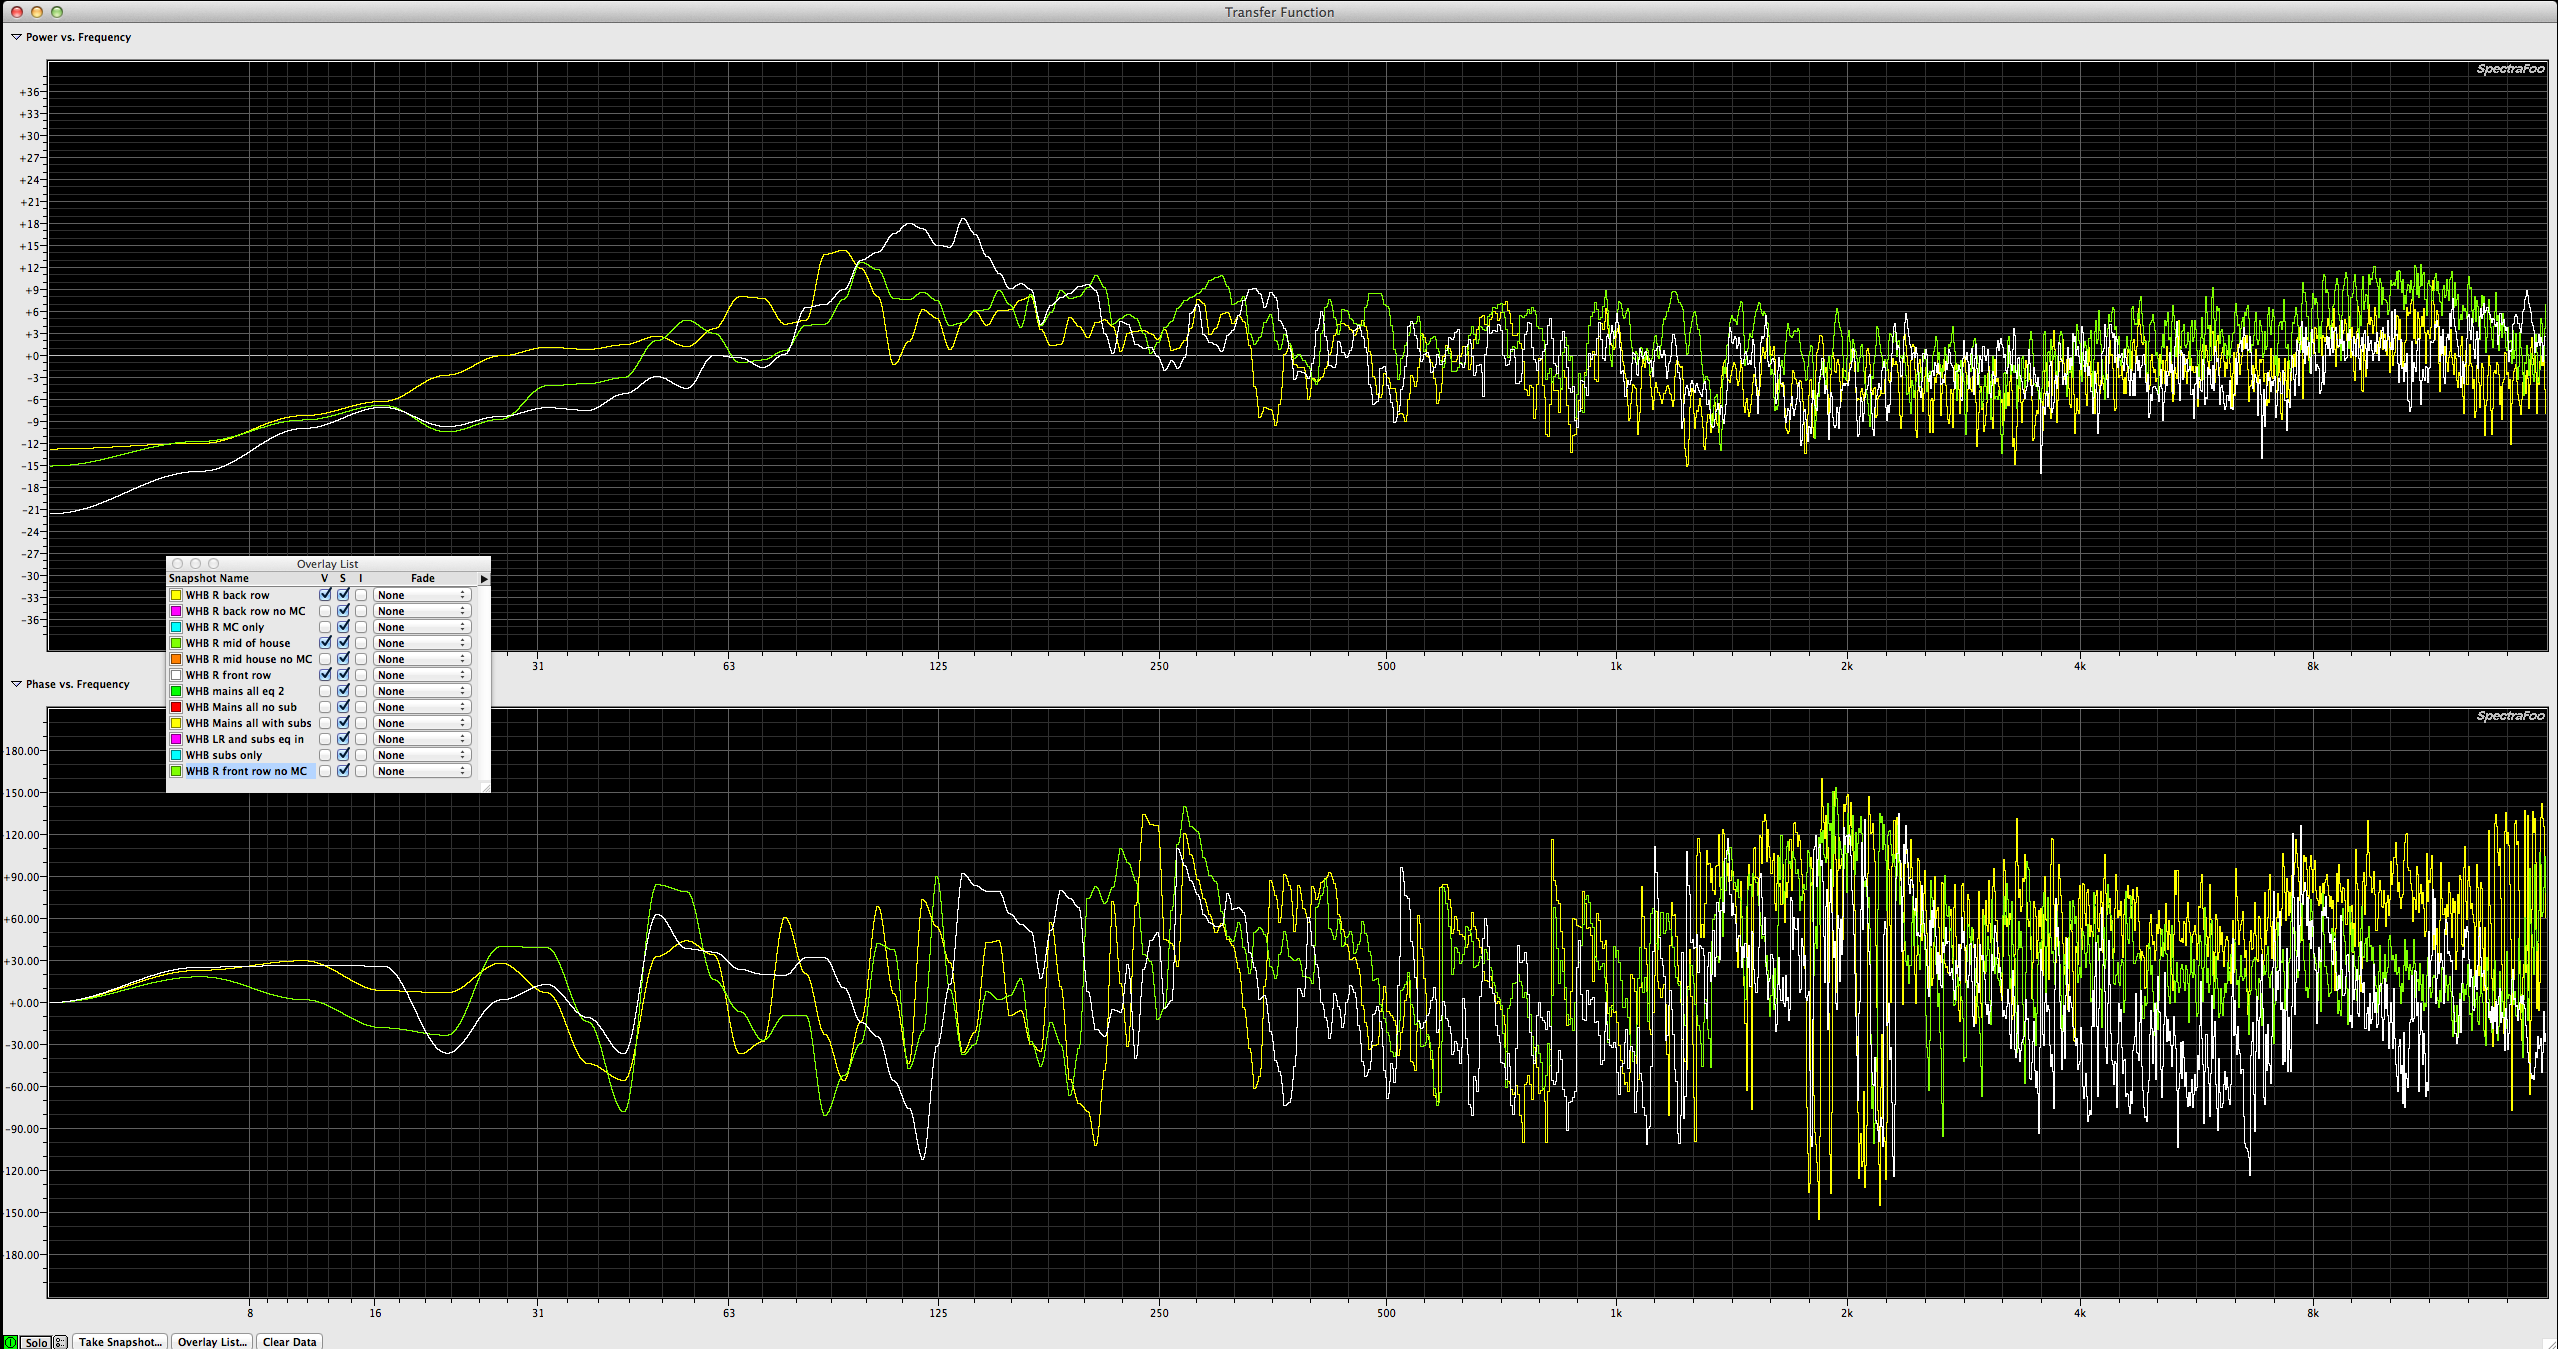
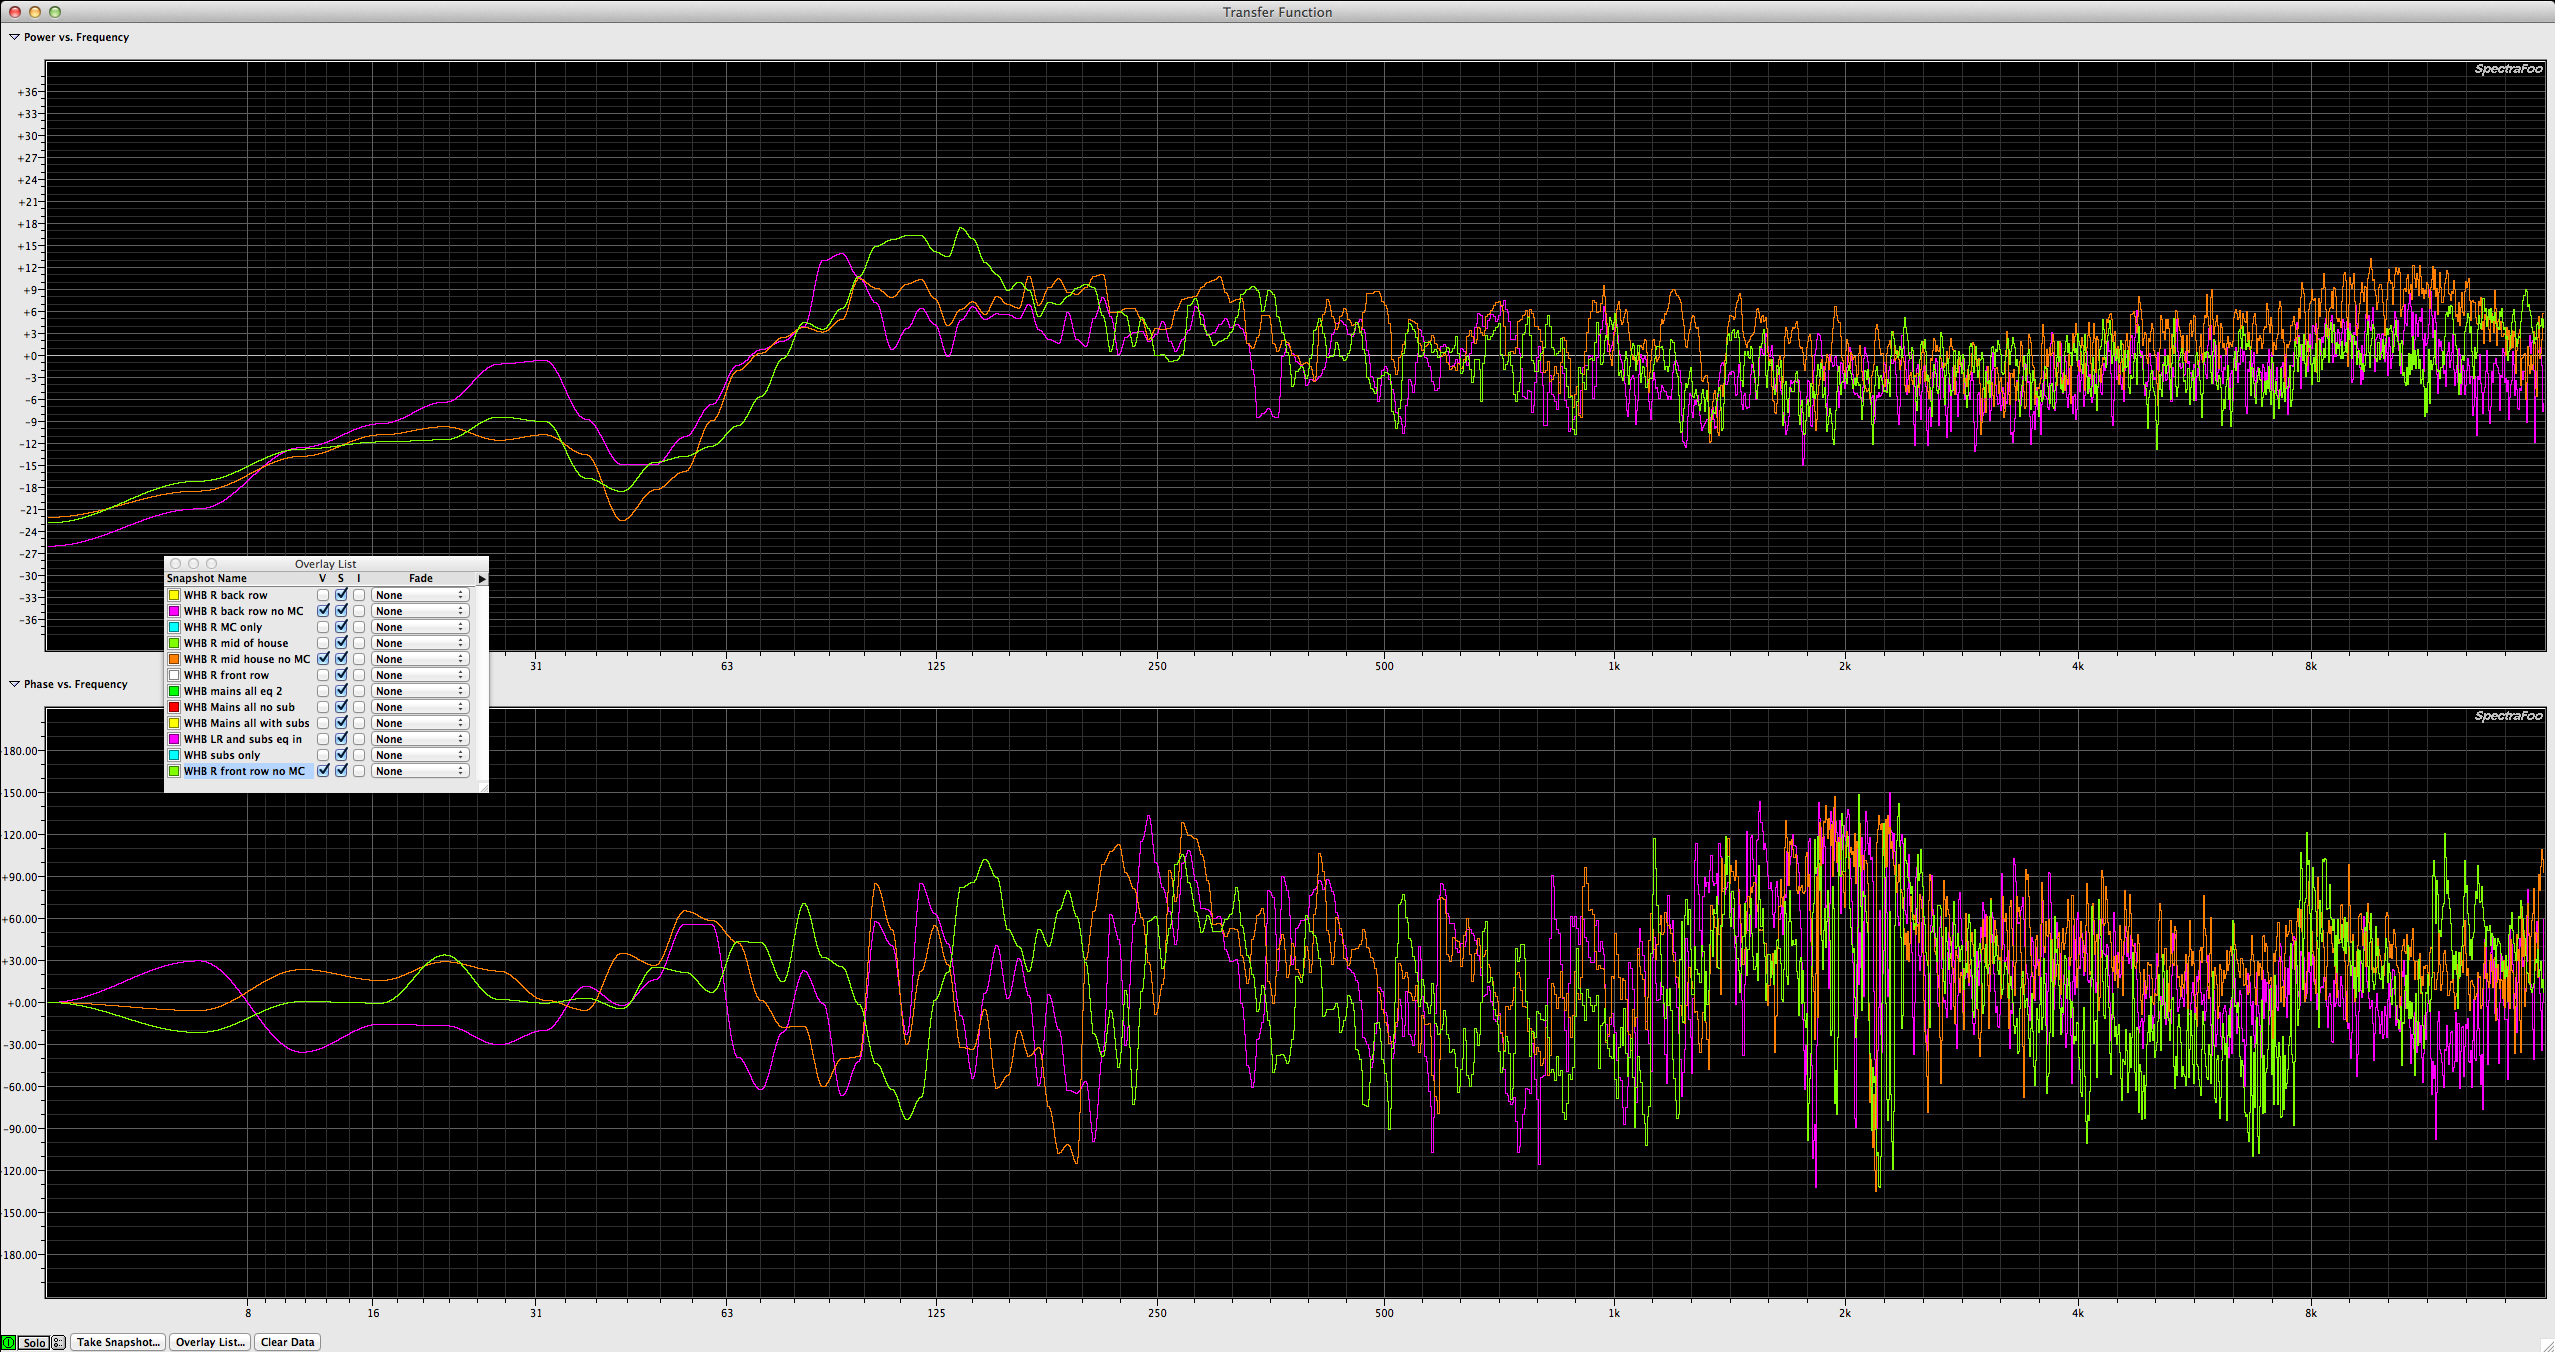
Once I got patched in to the house console, we measured the House R side of the PA at (3) different locations with the house EQ bypassed. First row, middle of house, last row. All on axis of the array.
Once I realized that the McCauley boxes were acting as flown subs, we muted those and measured again to see if that was the cause of the extra low end shown on the trace around 125hz. Nope!
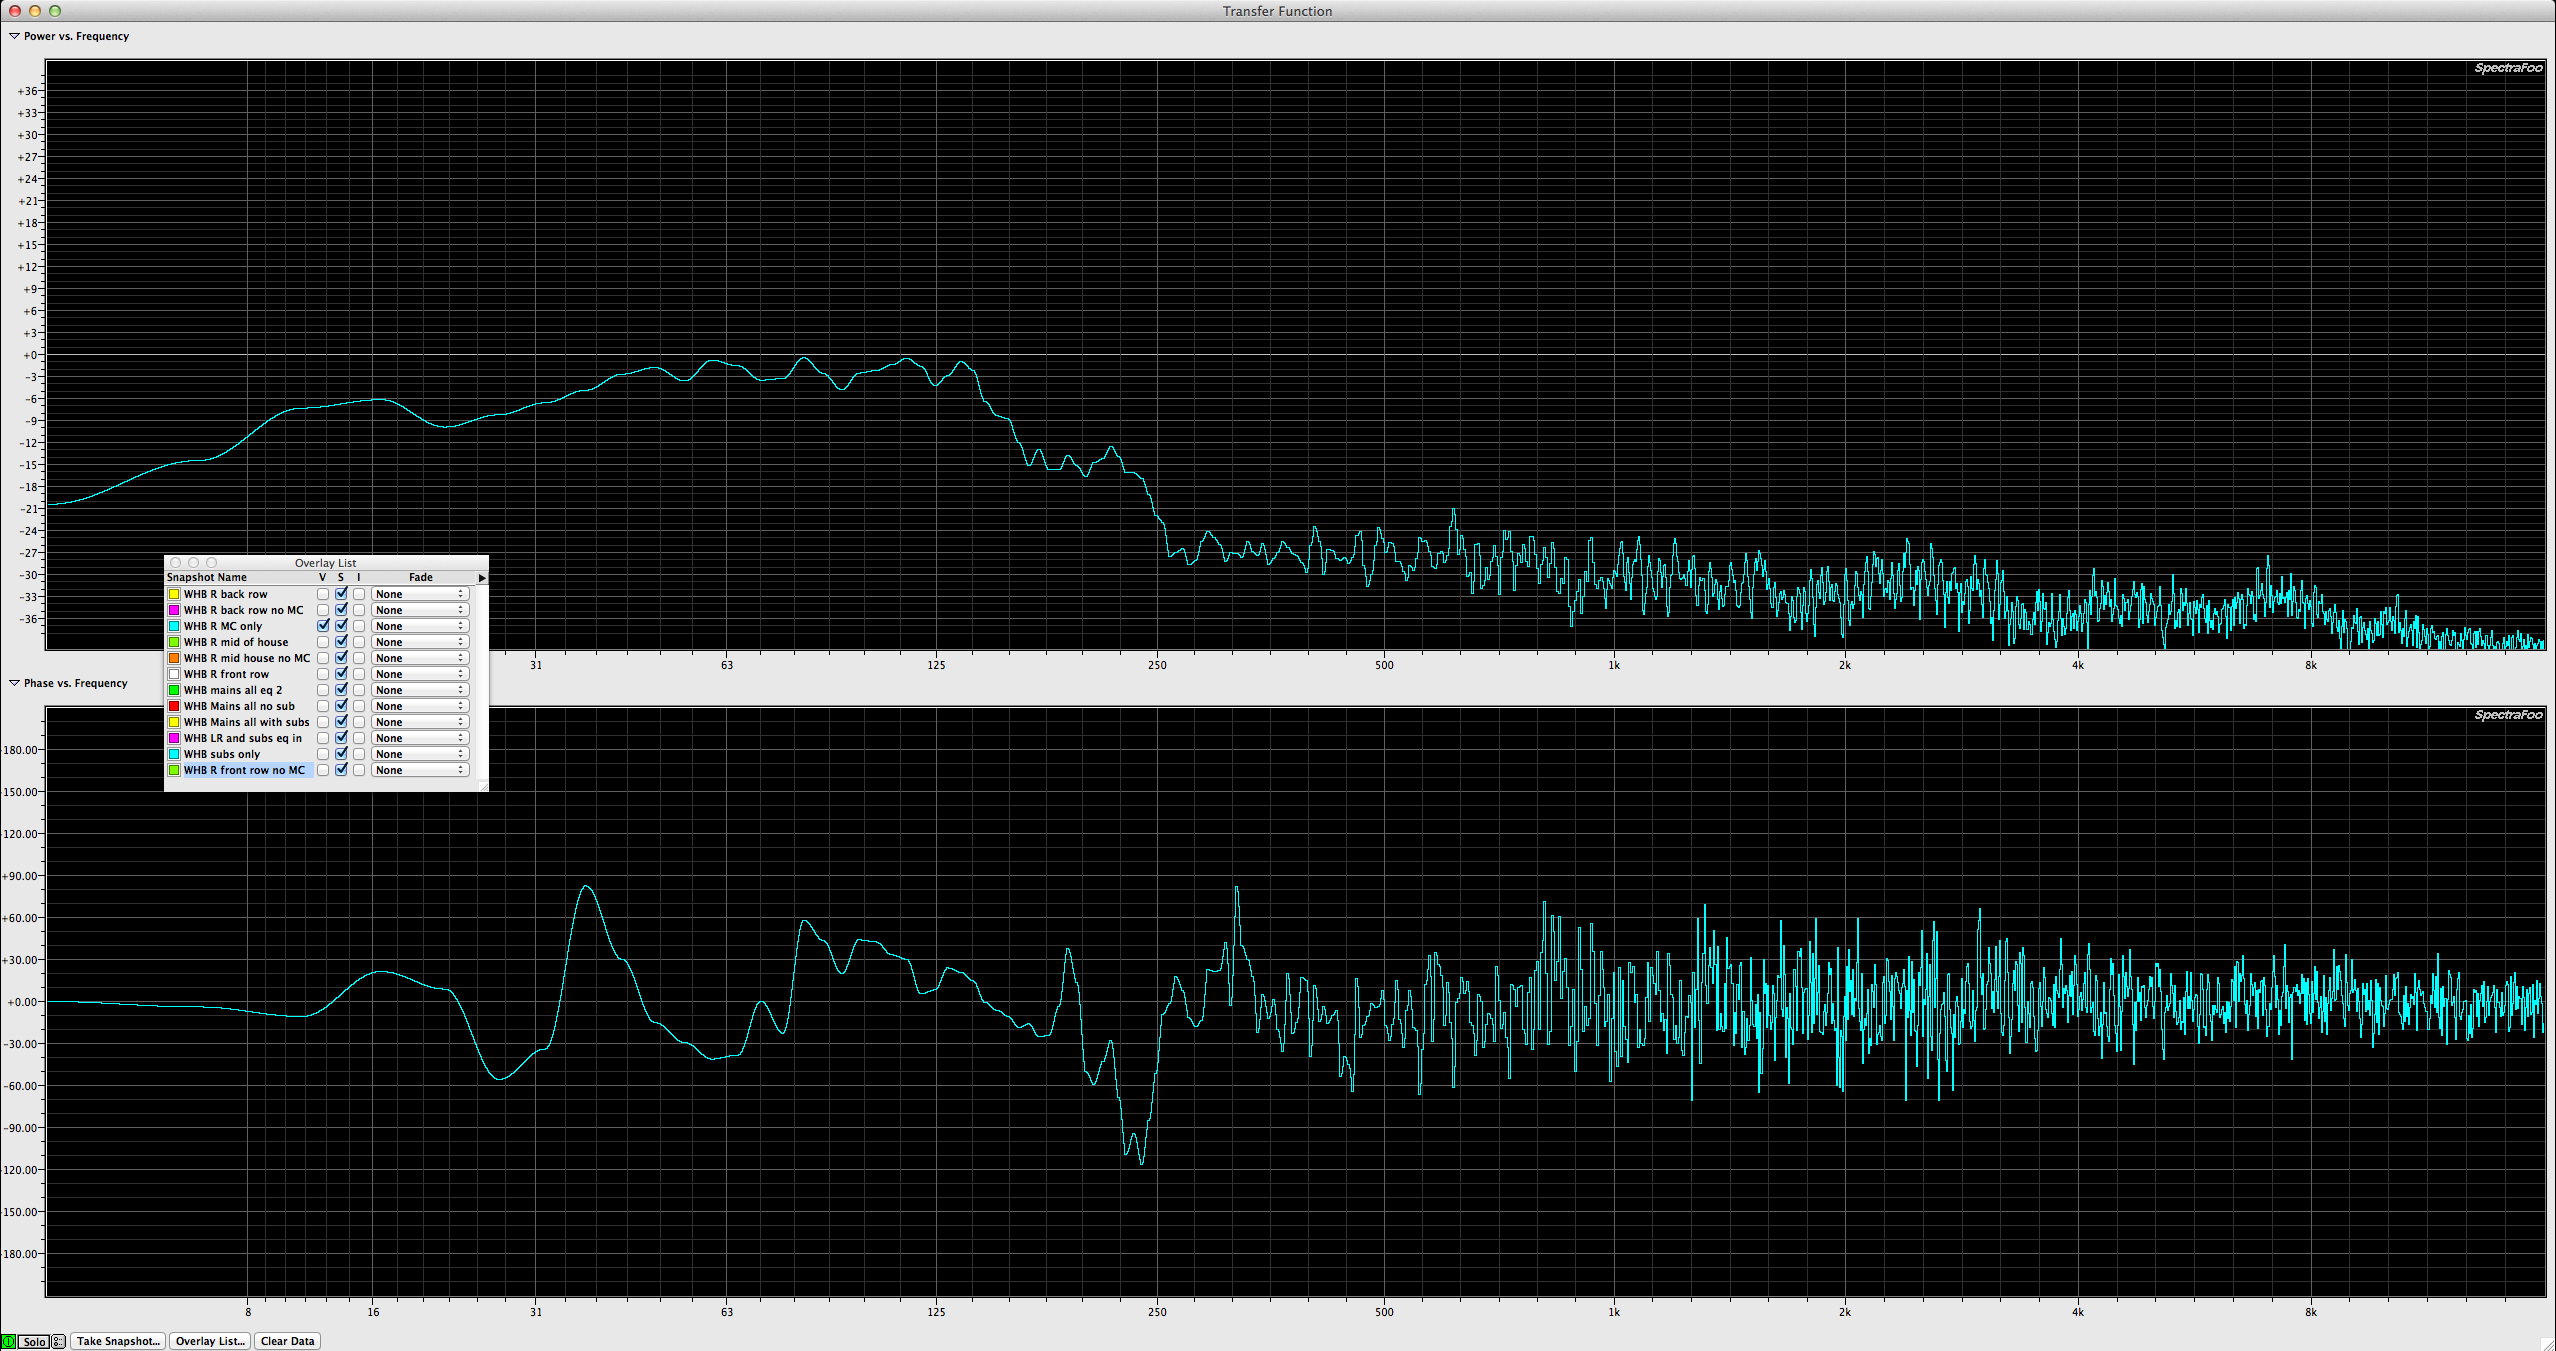
Here is what the HR McCauley sub measured by itself.
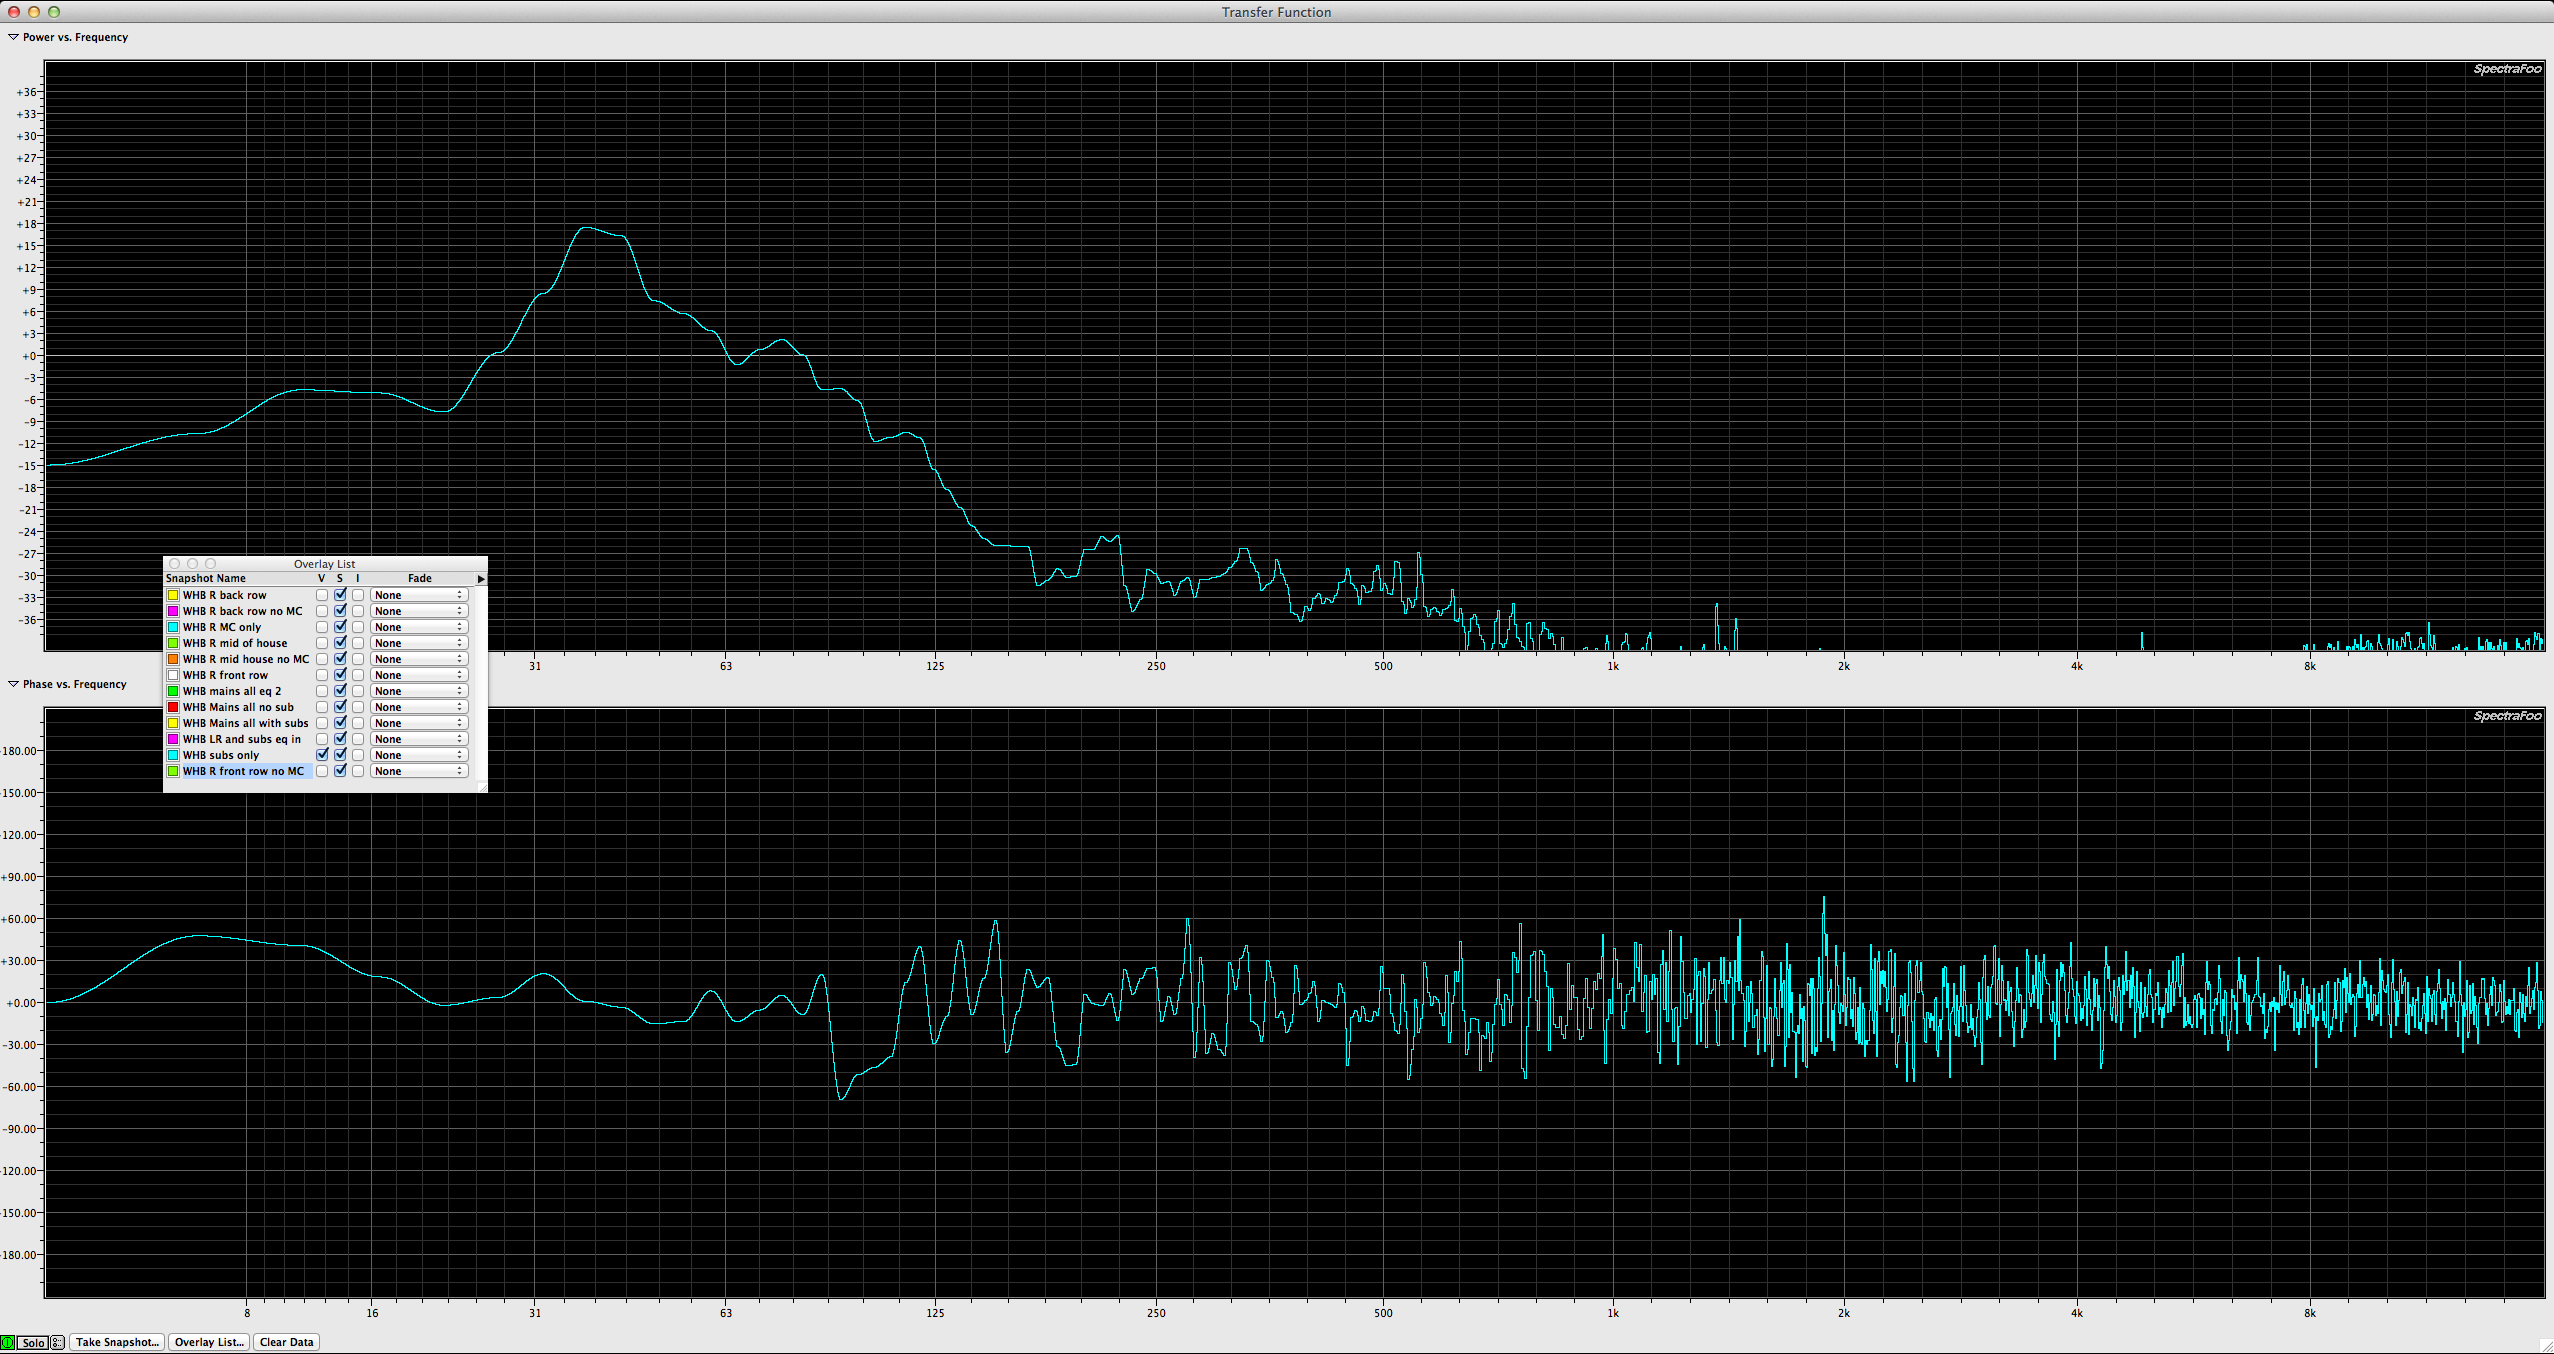
Here is what both JBL subs on the deck measured as:
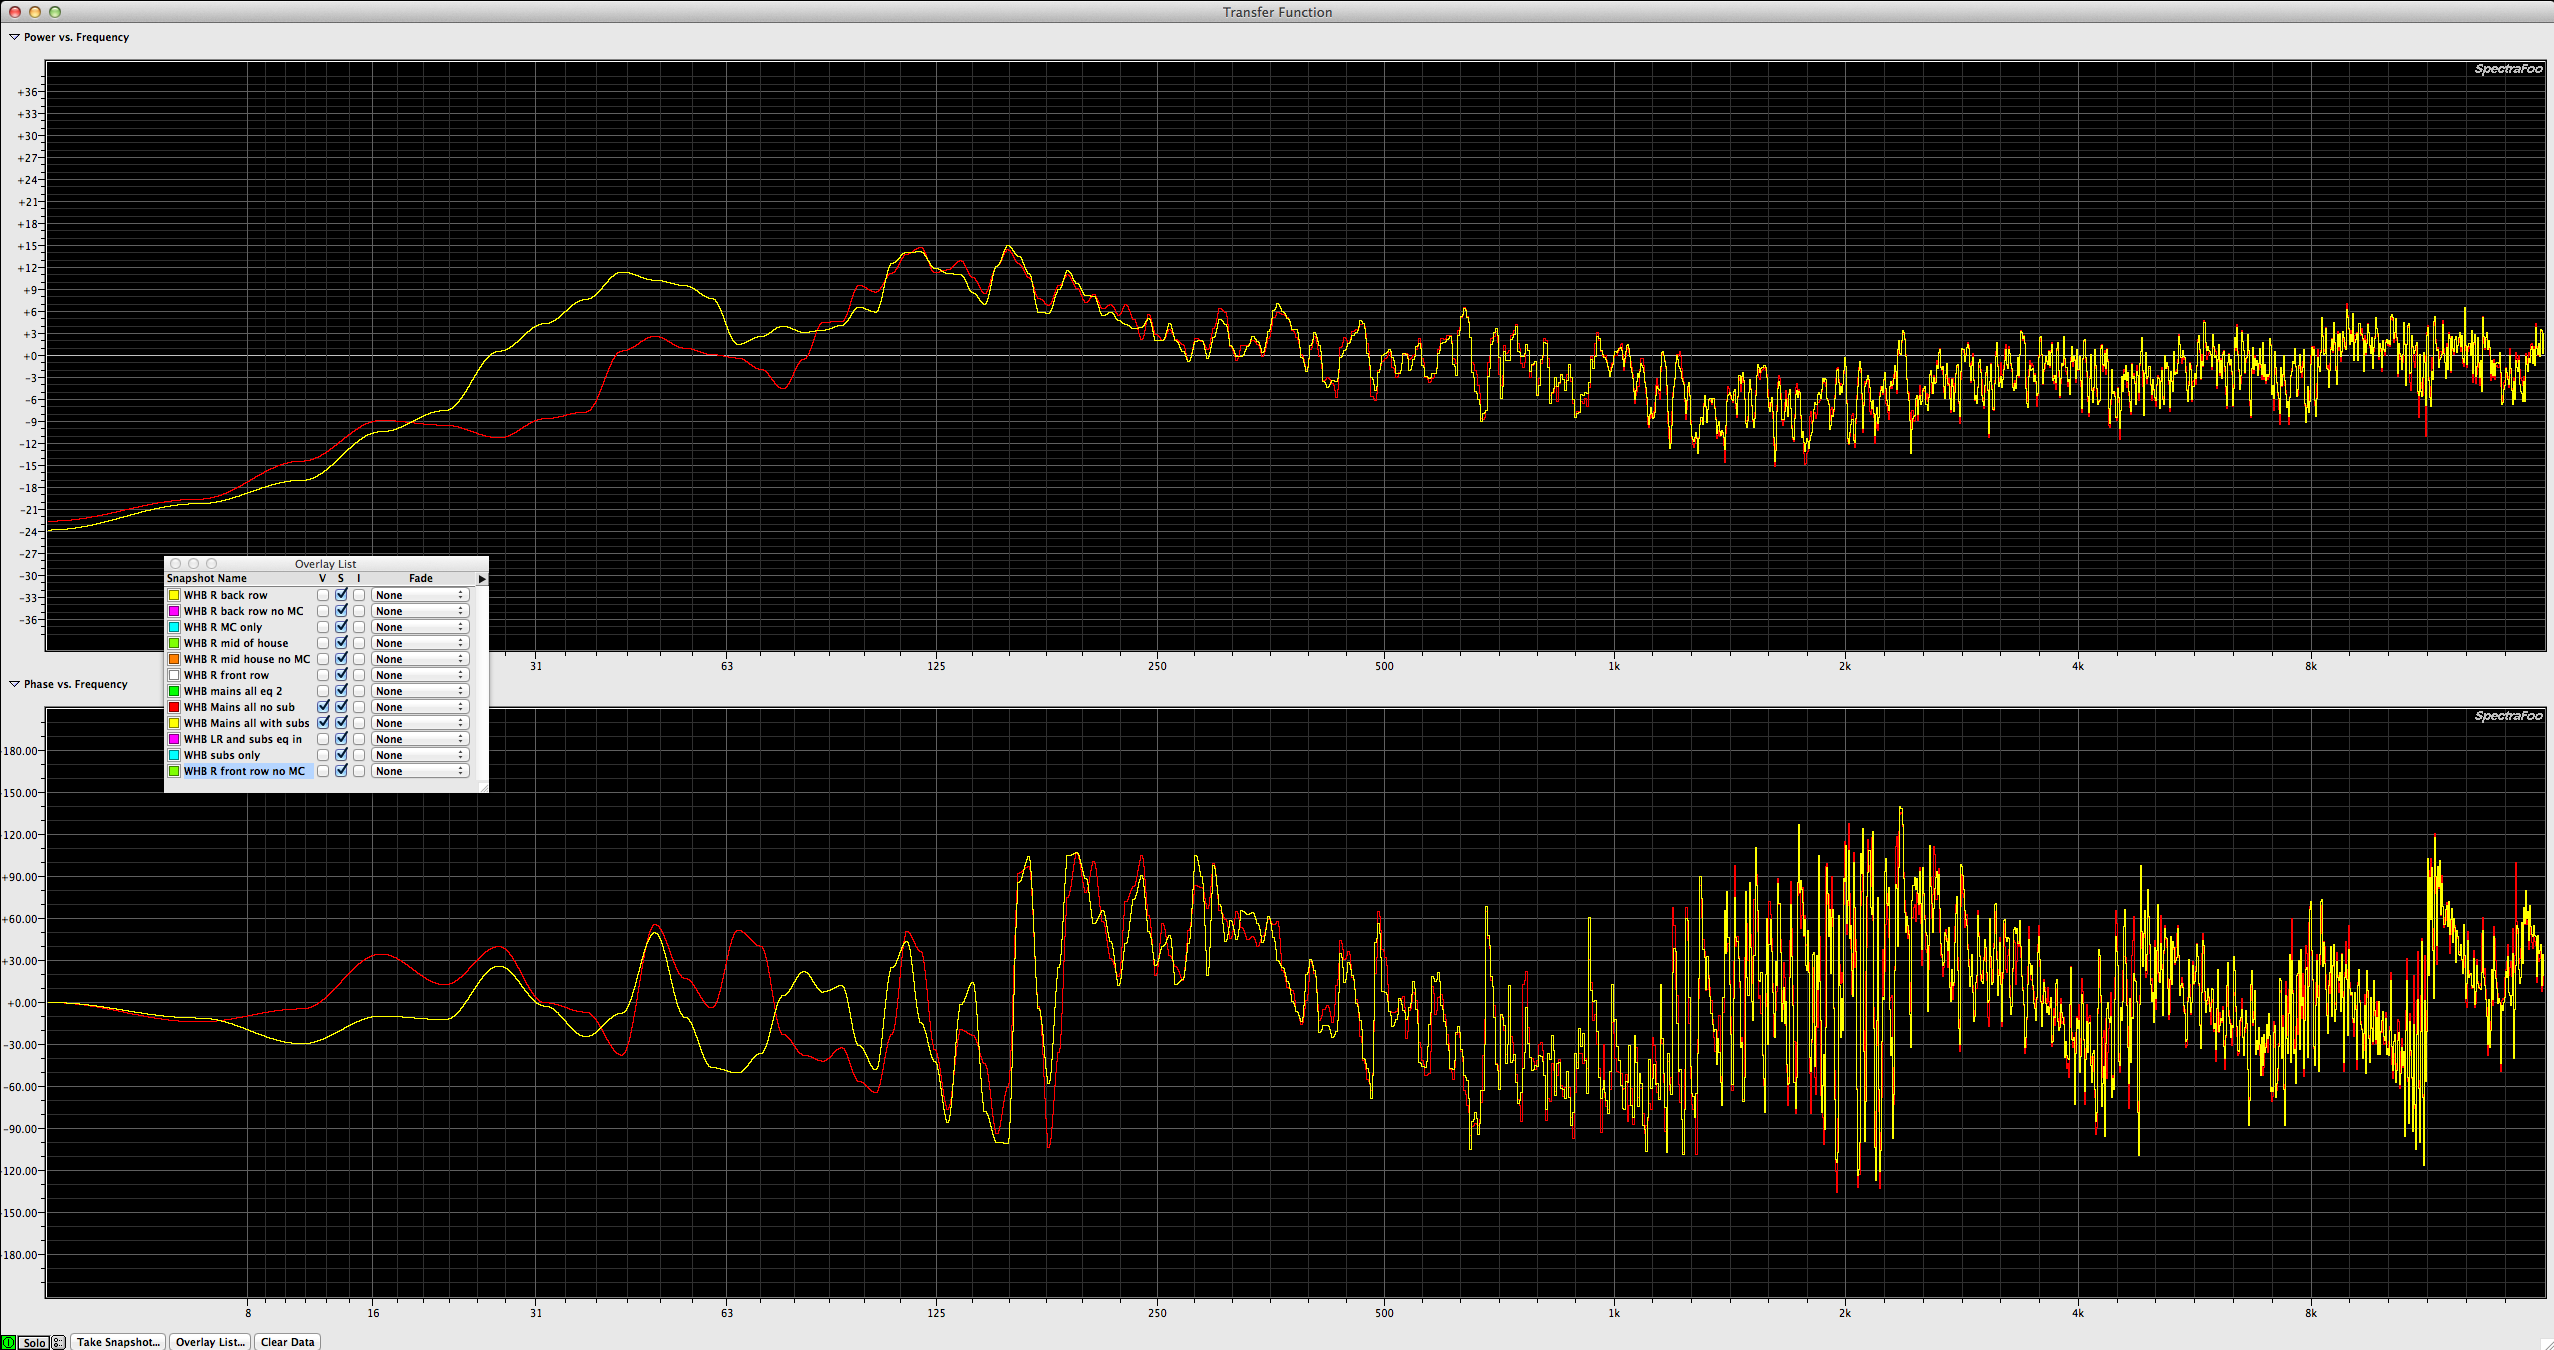
Here is the entire PA with and without the JBL subs muted:
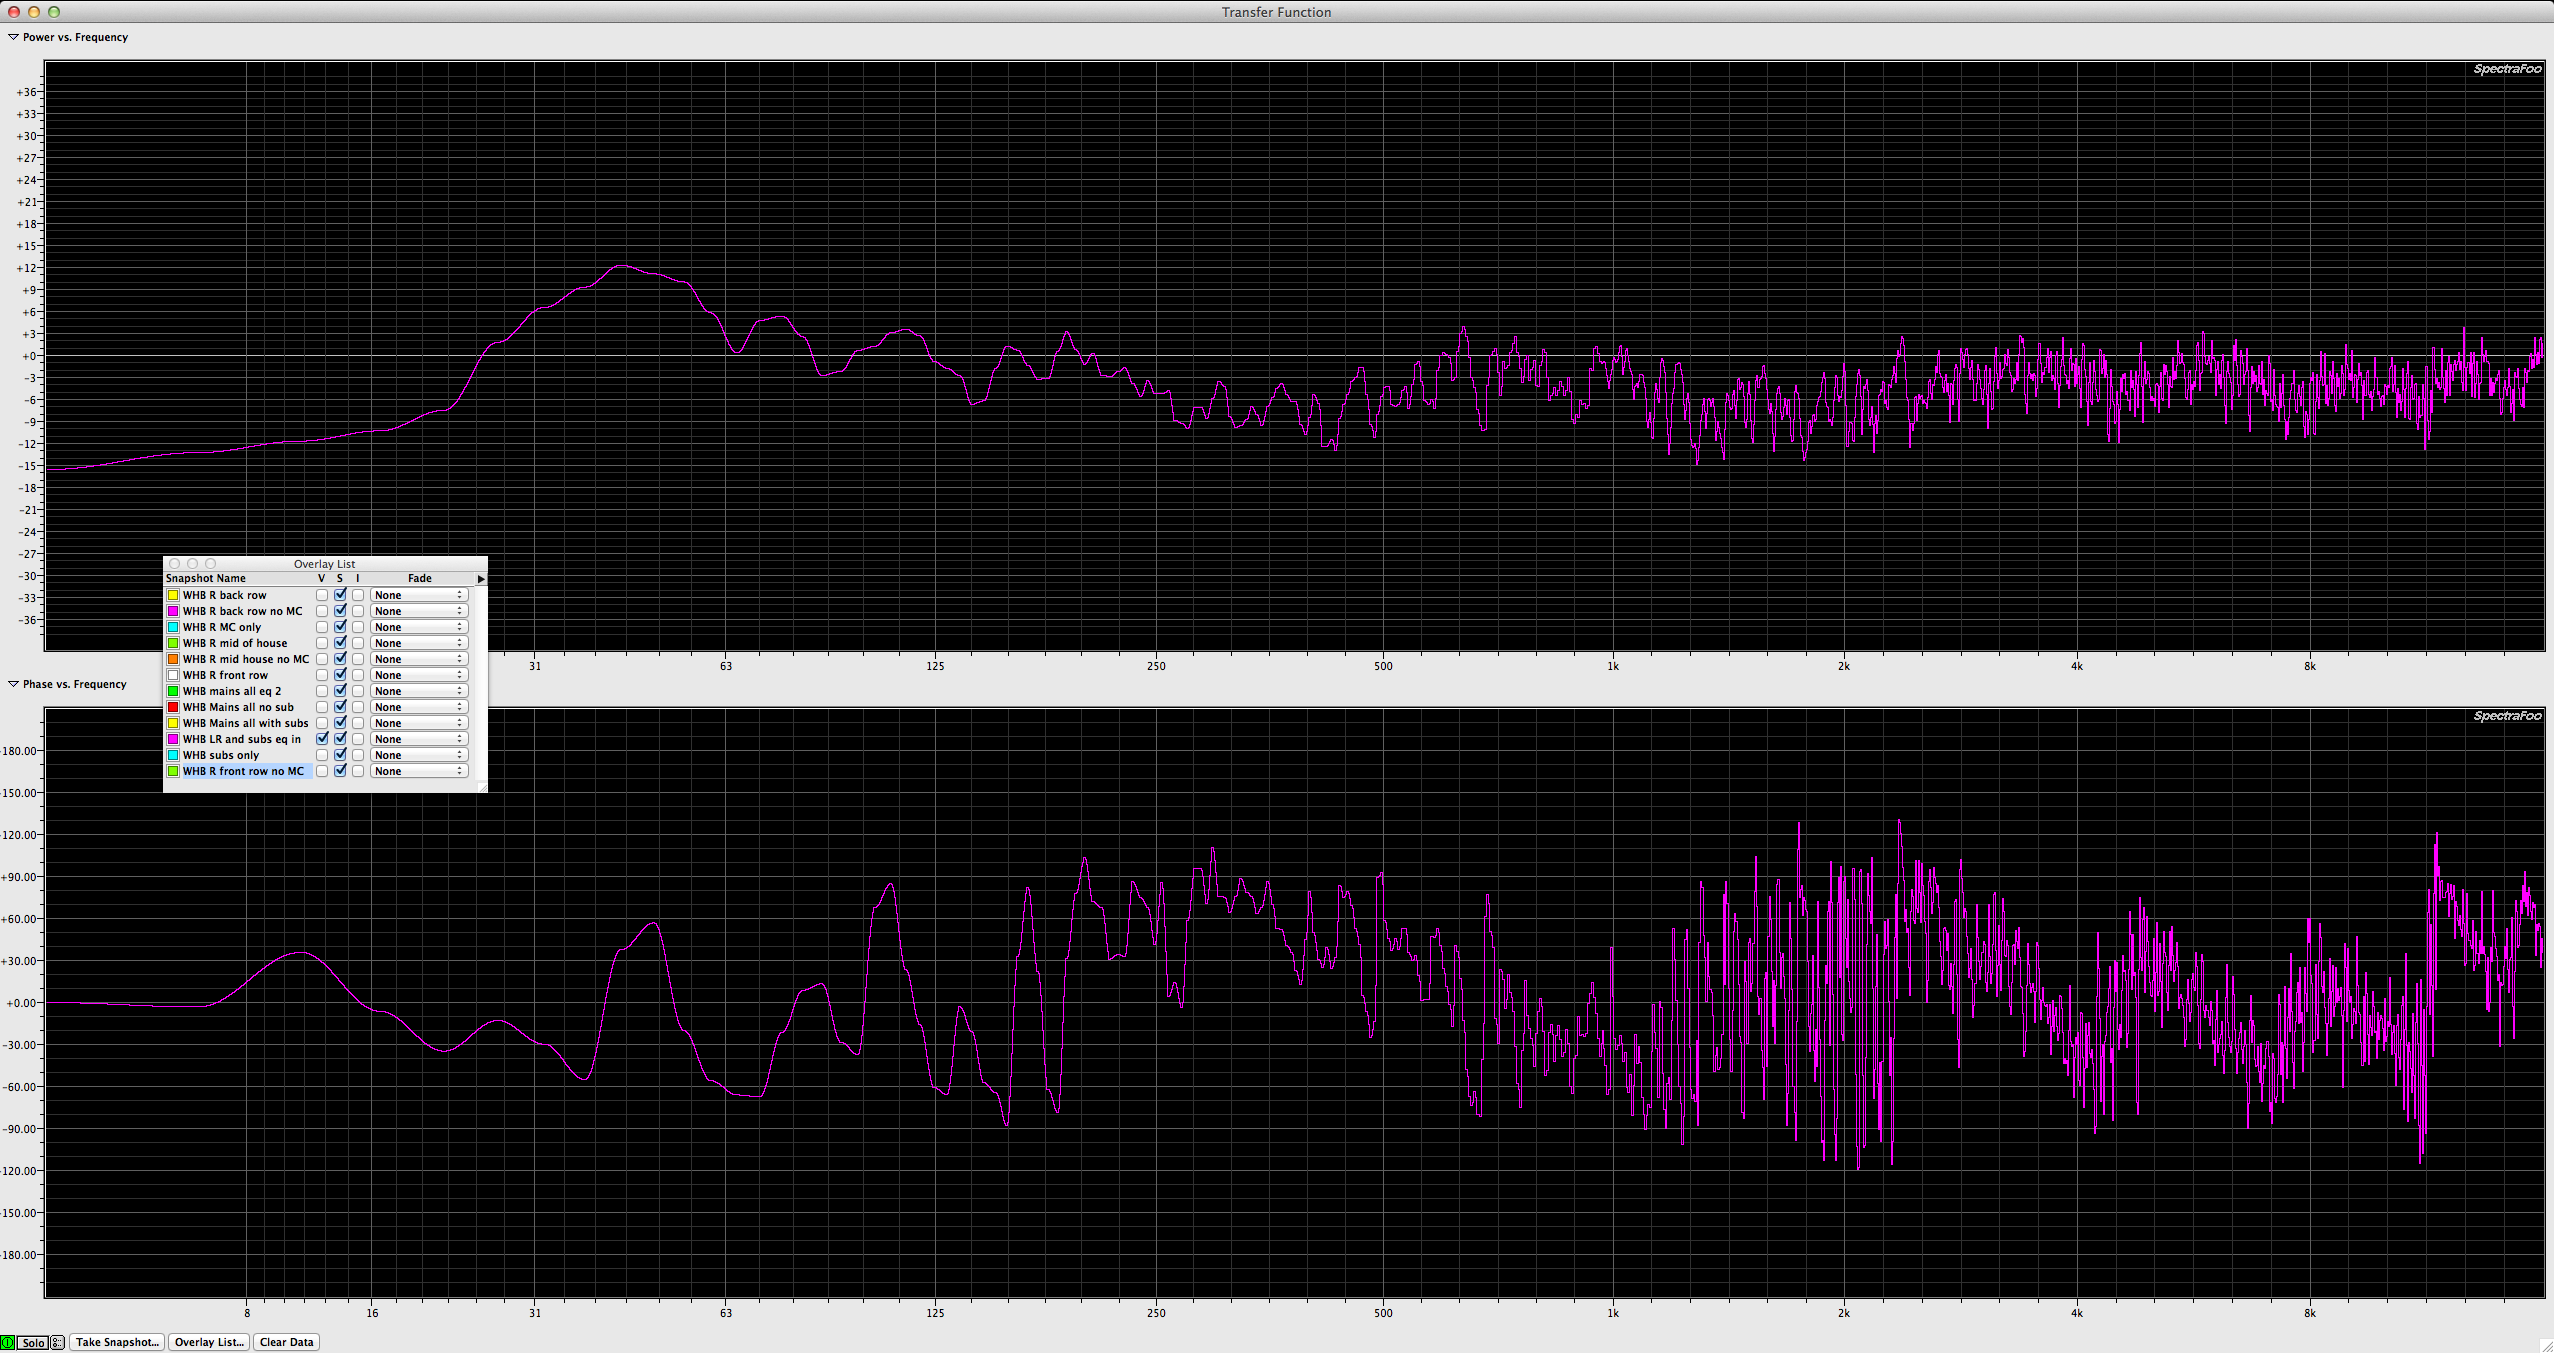
Here is the entire PA with the JBL subs on with the original house graphic EQ engaged:
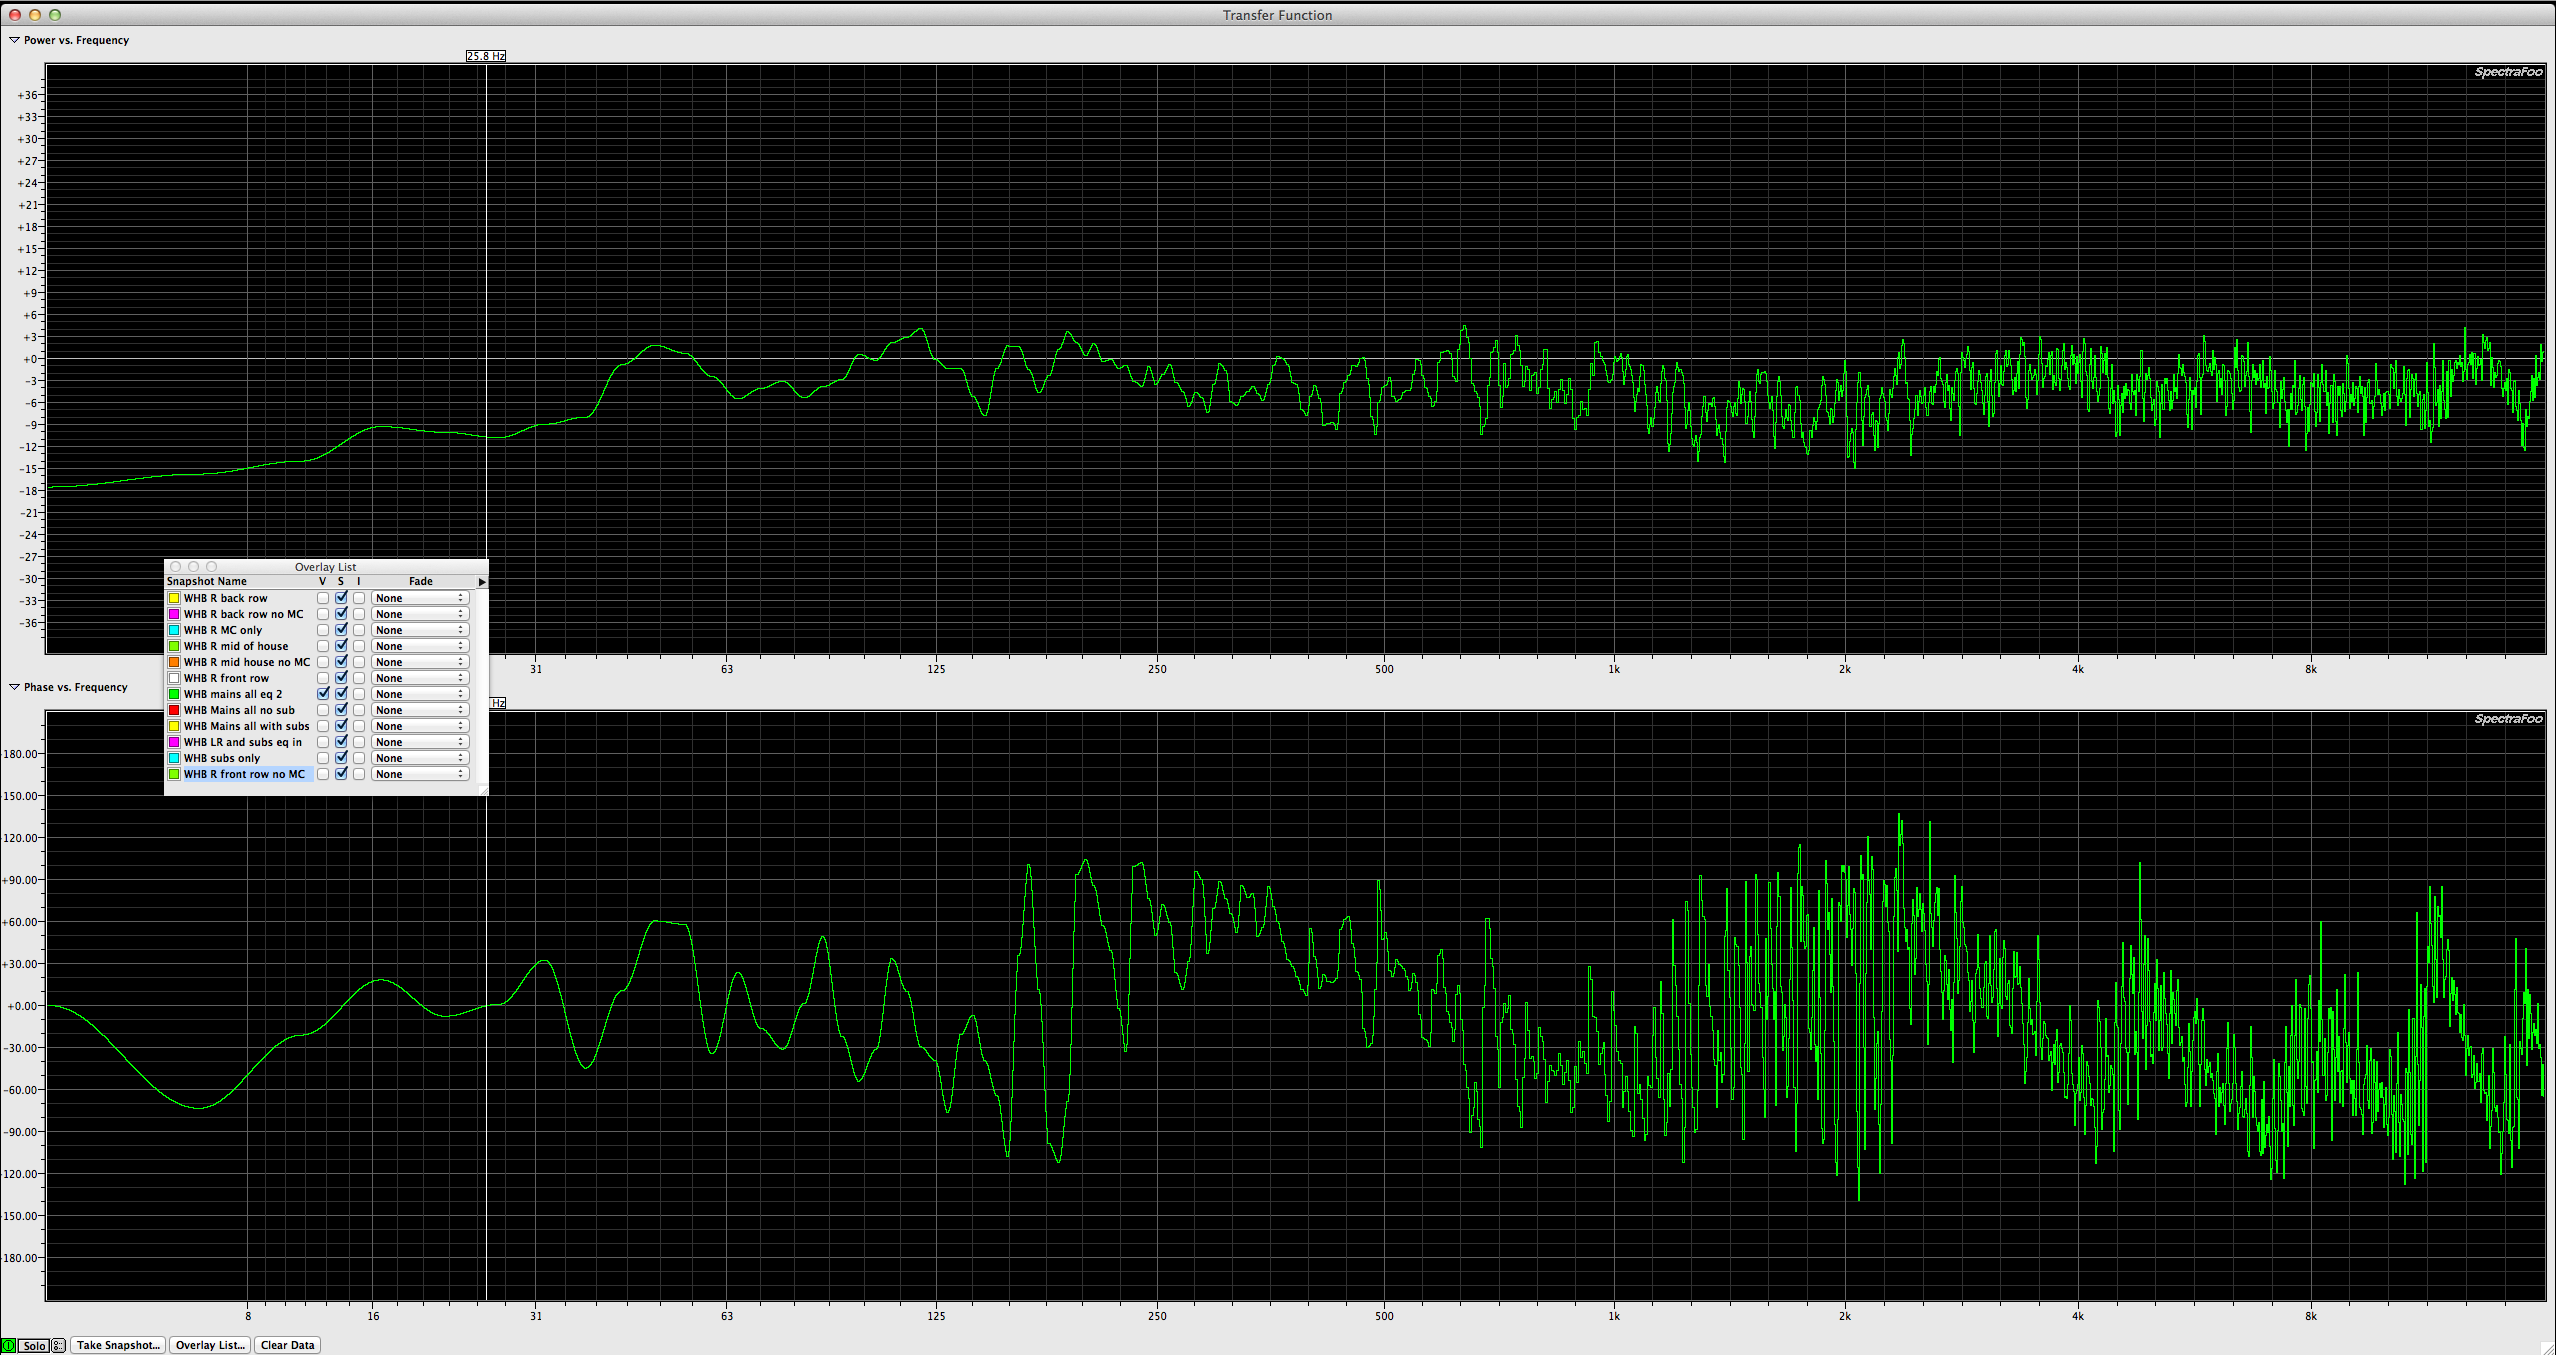
Here is the entire PA with the JBL subs on with updated graphic EQ settings:
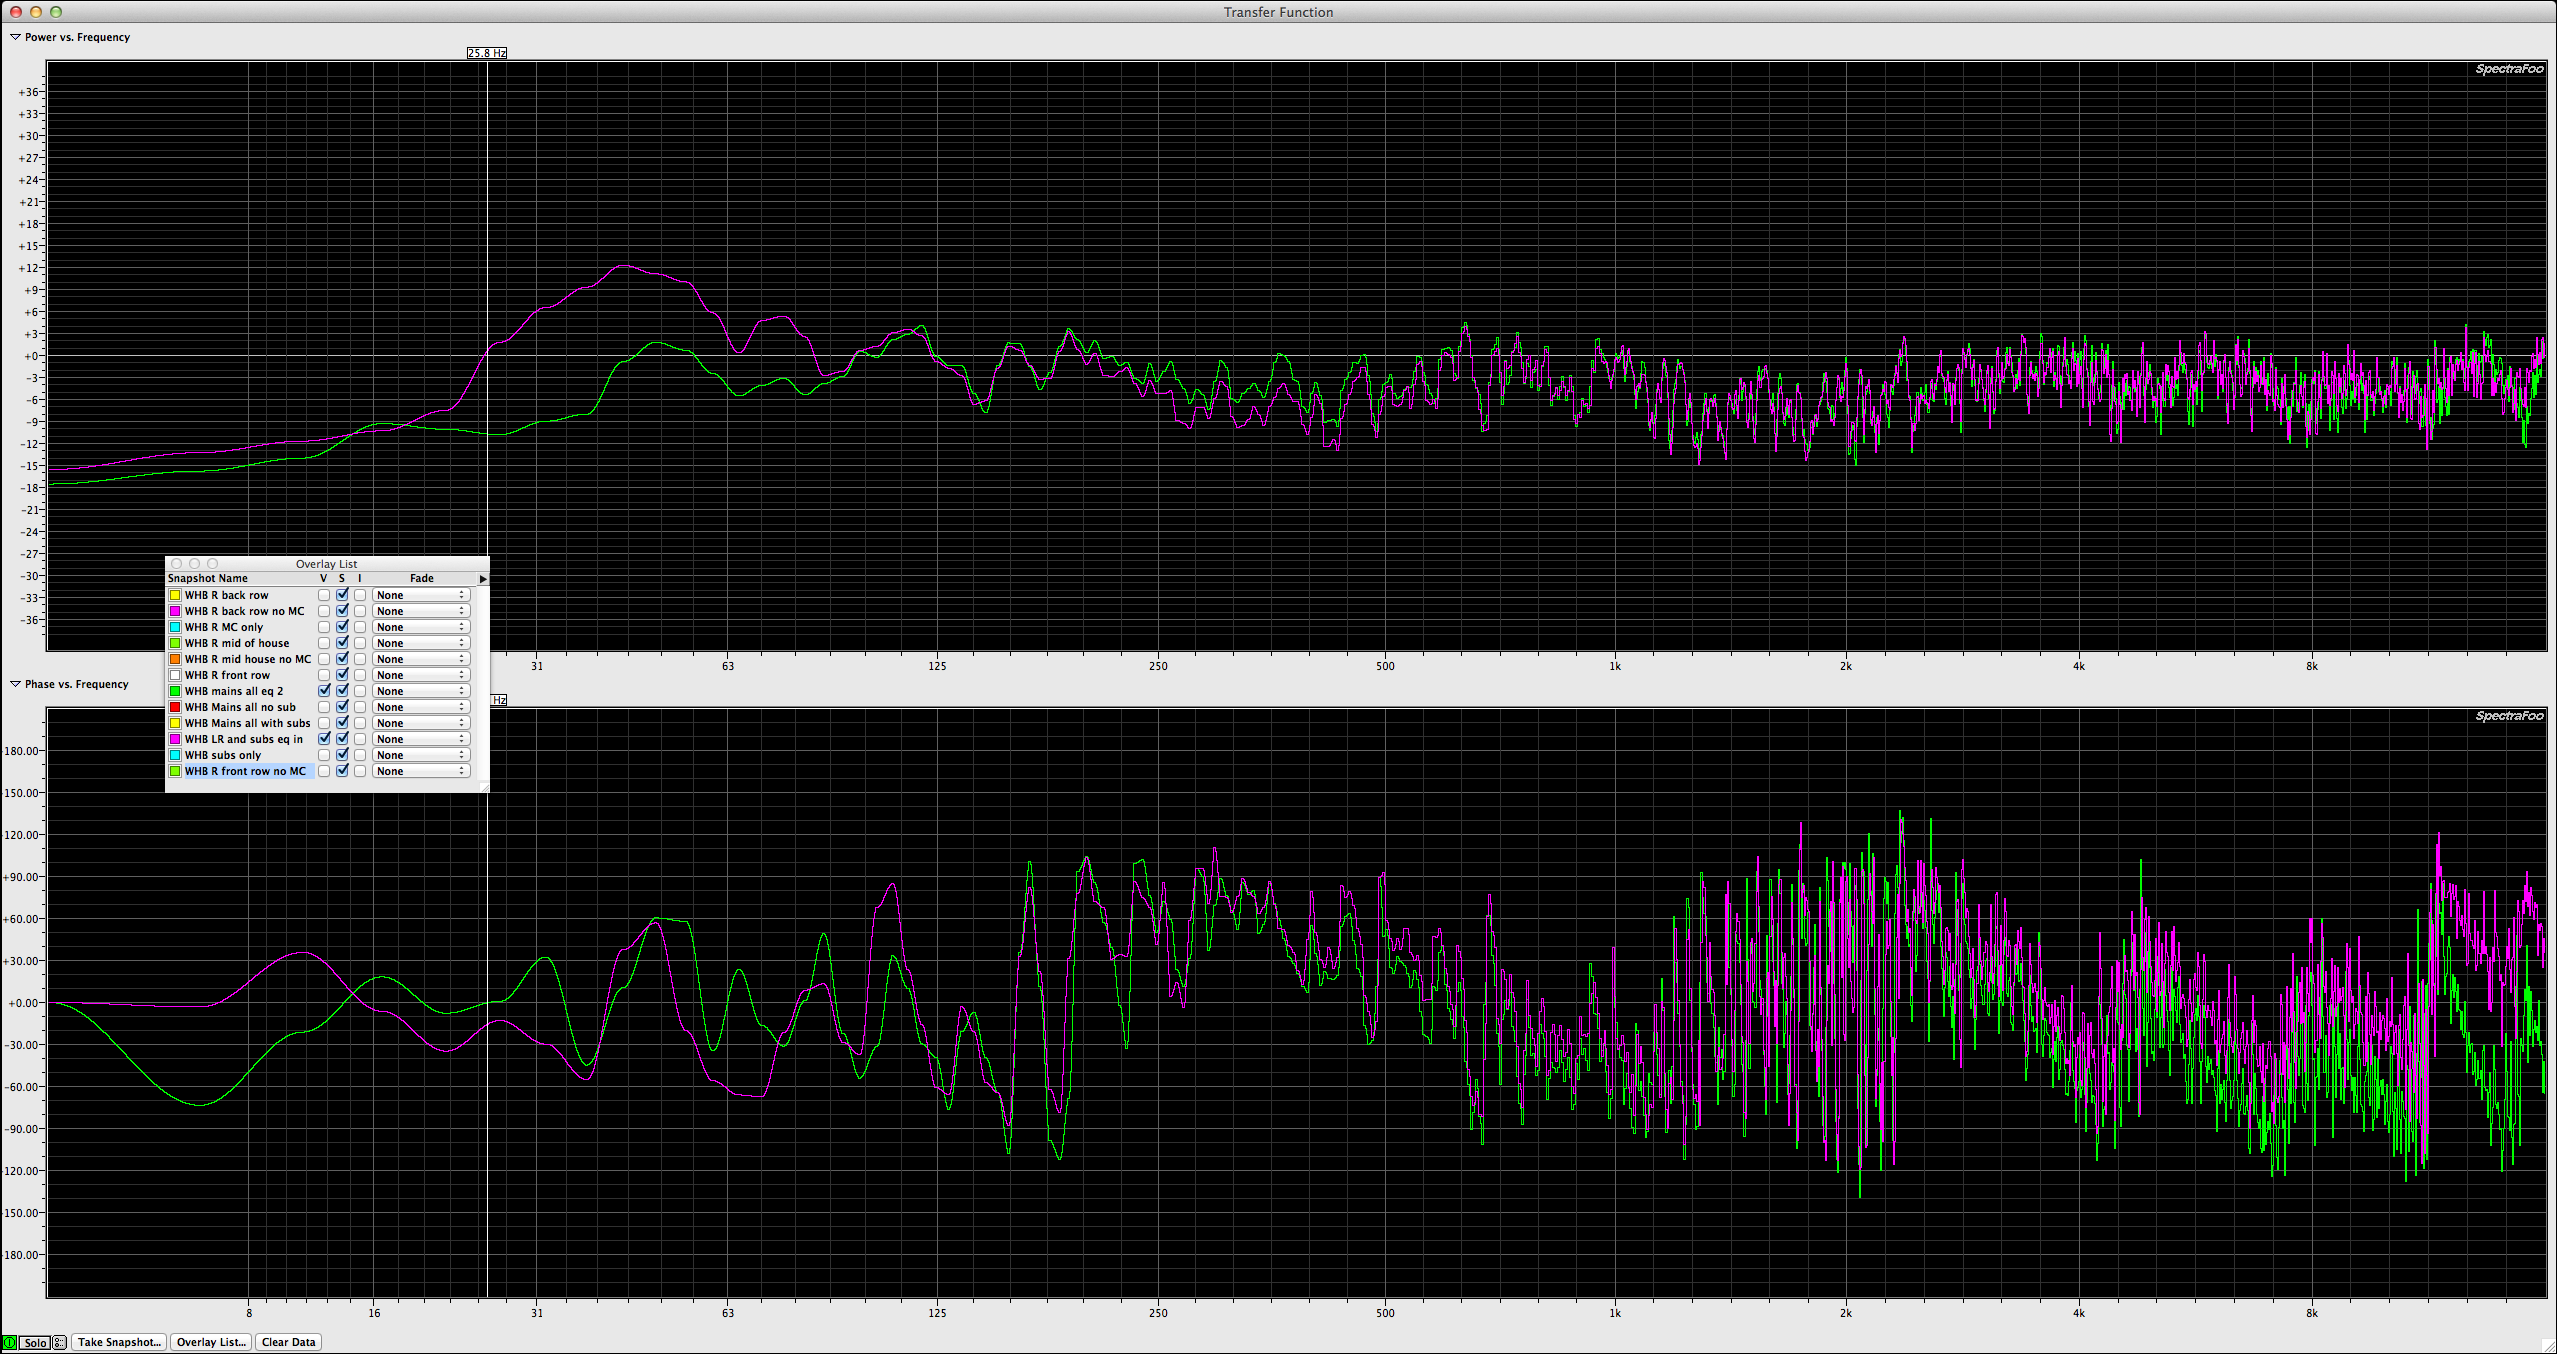
Here is an overlay of the two traces above. Before and after measuring with adjustments on the house graphic EQ:
With the entire PA (including subs) on and with the measurement mic in the center of the auditorium, we came to the following graphic eq settings by looking at the frequency response until it became somewhat flat.
You will note that it’s very similar to the original curve Jim came to just using his ears.
Regardless of which graphic EQ curve is better or worse, there is room for improvement at the DSP level. In a situation like this where no ones eqo is on the line and the system is used by visiting engineers constantly, ideally we would transfer the eq adjustments to the BSS Omnidrive DSP processors. This way the house EQ can remain flat and bypassed unless a visiting engineer wants to adjust things. We didn’t have a computer capable of talking to the DSP units, no guarantee there are filters available and we were out of time. We settled for a new graphic eq curve and drove back to Rockville Center where my hotel and gig were.
Note that the JBL subs are on an aux send so if an visiting engineer wants more low end, it’s available.
This story presents a good example of how it’s really helpful to measure PA systems without being under the stress and time crunch of a load in and setup. “We came, we measured, we left…”
