Matched pairs & testing speakers

A friend of mine just purchased a used pair of reference monitors for his home studio. In trying to help him make sure they worked before he made the purchase I realized that having a matched pair of something is a fairly handy situation.

If you have a matched pair of measurement mics, you can use them to verify each other and therefore any other mic or speaker.

This is not possible with single mics. Even when dealing with the same brand and model of microphone, you should expect there to be differences in sensitivity and frequency response. There is zero motivation for a company to worry about tight tolerances if no one is willing to pay for consistency. For example, paying $100 (or less) for a measurement mic is a gamble and the odds of randomly finding two that match is probably on par with securing a winning lottery ticket. Obviously your odds are much better once your budget allows for purchasing a mic that comes with a custom frequency response and sensitivity value document but even then, there is nothing inherent to the industry that guarantees that if you purchase single mics and you don’t specifically arrange and / or pay for matched mics, you’re getting a matched pair. This is why matched pairs typically cost more and are available only through high end companies. Because someone has to go to the trouble of hand sorting an matching mics. My recommendation is to work toward having a matched set of measurement mics.

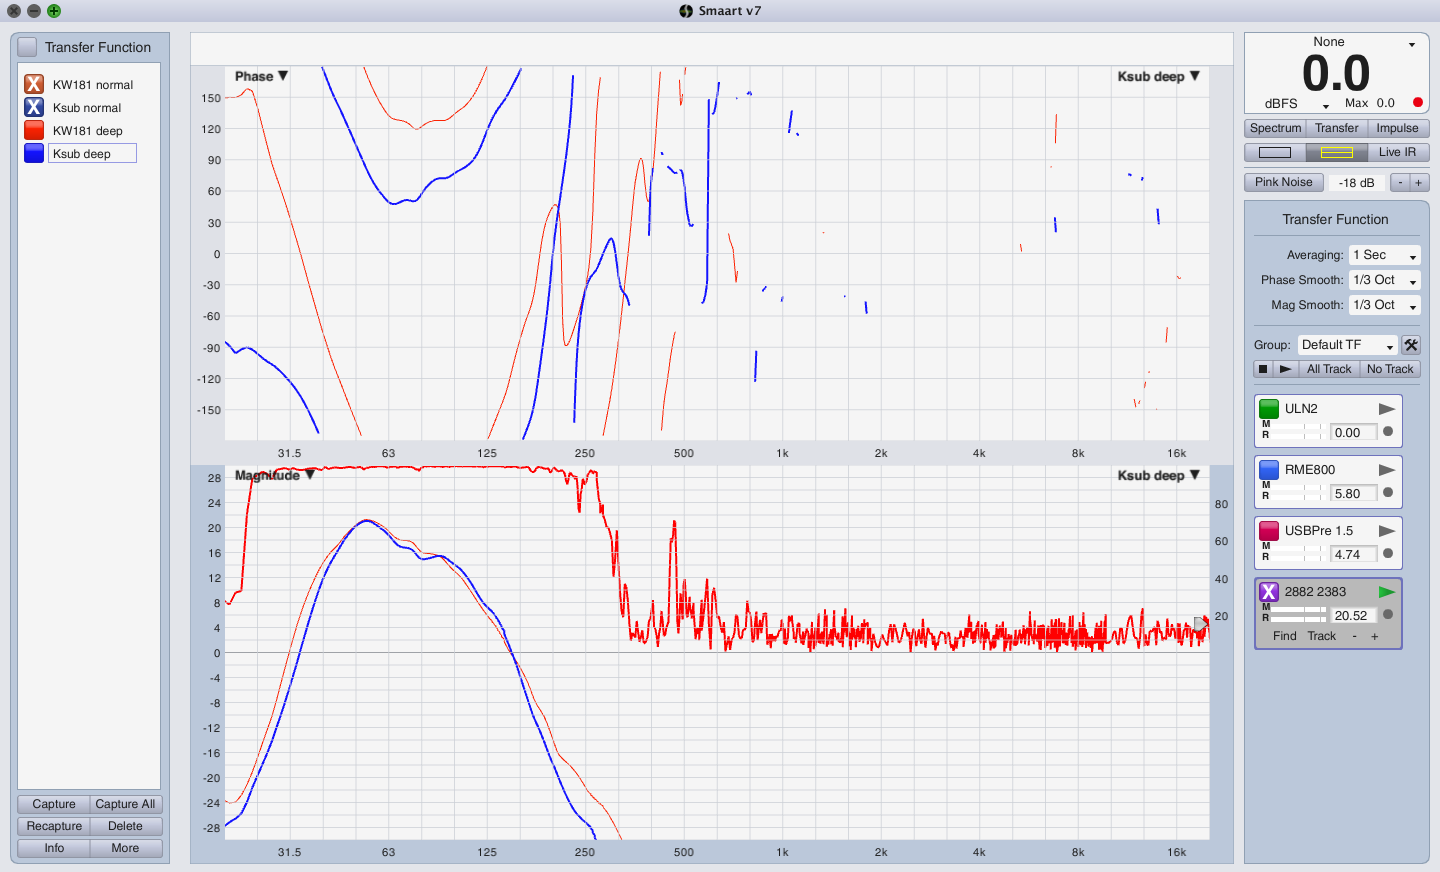
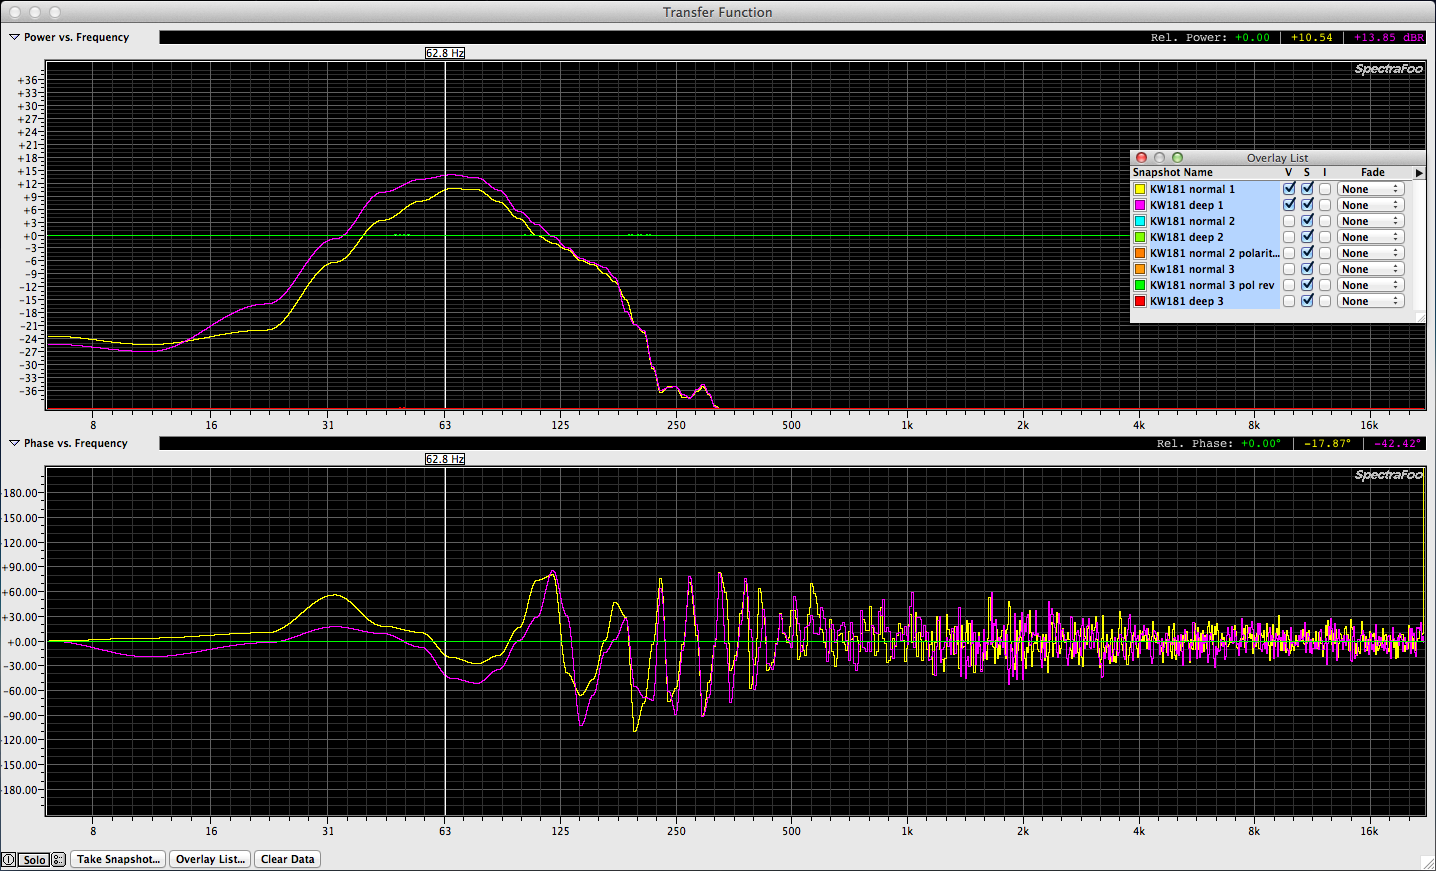
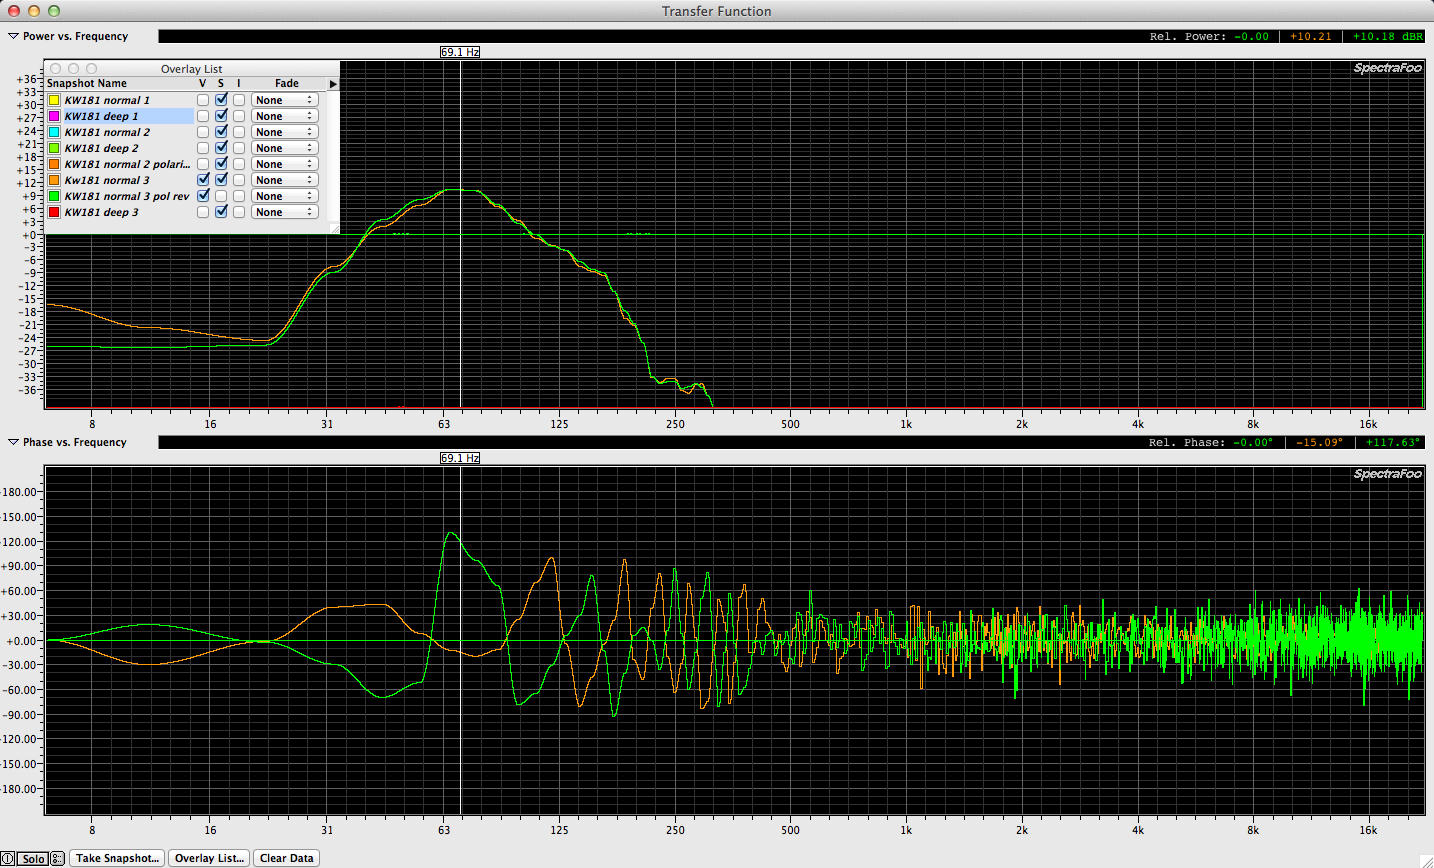
Regarding matched pairs / sets, the same is true of speakers. If you compare two of the same brand and model of speaker made at the same time and they haven’t been modified or repaired, you could expect them to match. Loudspeakers produced by companies with a good reputation are going to be fairly consistent but may change the design over time so there is no guarantee a new one will match an old one. This could be due to a design change, a part that is no longer available, etc.. Consequently your best bet is to buy the amount you need at the same time. In the pro audio industry, an industry standard for many years was the EAW KF850. Many different versions of the KF850 were released and so unless you purchased them all at the same time, there is no telling what is inside the box at a driver / crossover level. If you have known speakers born at the same time and you need to test them, you can use one to test the other. If they match, you can be confident that testing the others will reveal any anomalies. While FFT based transfer functions are ideal for comparing things, the tool is not the ideal tool for testing a loud speaker for mechanical issues.

One of the most important tests that can be performed on a speaker is a simple sweep test using an sine wave audio generator with a variable frequency knob. This sort of test will likely reveal any buzzing or mechanical distortion which could be caused by abused drivers, enclosure air leaks or lose materials inside or outside the enclosure. These are issues that likely would not be found using pink noise and a transfer function. Why? Because the noise itself might mask the issue. When you sweep sine wave from low to high or high to low you’re asking the loudspeaker (drivers & enclosure) to reveal it’s linearity. So before I would spend any real money on a pair or set of speakers, I would want to hear them reproduce some sine wave sweeps before I completed the deal. Then I would bring them home and measurement them both and store the traces. This way I could always verify them at a later date to make sure they’re still functioning as designed.

How to measure and optimize your car stereo – part 2

Last night I finally took my first round of measurements and performed an initial optimization on my Scion XA car stereo. Unfortunately running my laptop on batteries for too long, it died and I lost all my data. This morning I reset the gear and started over. Even though the car stereo appears to have some useful EQ, the options are still rather limited. Maybe someday car stereo manufacturers will just provide multiband parameteric eq and delay for each output and we can truly optimize the system. In the meantime this is what I came to:

As I would when measuring a sound system, I began the process by panning and fading to only one speaker zone. In this case I chose the front left door speaker / tweeter (they are wired together). I took various measurements of just that section of the car stereo including what the high pass filter did.

The high pass filter has the following settings to choose from:
Through (no HP),40,80,100,120,150,200,220.
Here are the results of measuring each one of those:

I performed the same high pass filter measurements with the mic in the rear left passenger position. Here are the results of measuring each of of those:

How to approach the optimization process? I tried a few different ways and none of them provided an ideal result. In theory there should be enough DSP to perform the necessary EQ. The receiver offers bass, middle, treble adjustments that include center frequency, boost / cut and Q (filter width). Unfortunately the frequencies you can choose from don’t correspond with the adjustments I wanted to make. The treble frequency centers start at 10k and go up. I left that flat. The middle frequency center starts at 500hz and goes up. I wish it could down to the 200 / 250 range. That is where the frequency content I don’t want is but I can’t get to it without scooping out too much 500. The bass center frequencies are useful but the Q isn’t flexible enough to make the adjustments I wanted to make.

Harmony Fellowship – stage monitors

Today I returned to Harmony Fellowship to add a Yamaha YDP-2001 parametric EQ to the system to process the stage monitors. The venue has (2) Yamaha SM12V wedges linked together on AUX 1 & a newly acquired Rockville self powered 15″ / horn wedge on AUX 2.

My first measurements were to verify that the two Yamaha SM12V wedges matched each other. They do.
Yamaha wedge comparison

Yamaha Club V series
Specs for the Yamaha SM12V & 15″ sibling:
Yamaha SM12V specs

Having verified that the Yamaha wedges match, I unplugged one of them so I would be measuring only one of the speakers. I took another measurement without any eq as my reference point and began adjusting the new parametric EQ to smooth out the response of the SM12V wedge. Here is an overlay of the before and after frequency response traces.
Yamaha wedge pre and post EQ

The SM12V is an affordable floor wedge that measures relatively flat for a 2 way passive design. The one thing I dislike about the SM12V design is how the 40 x 90 horn is turned with the 90 degree side in the vertical plane. Having a 40 degree pattern horizontally in some cases is a good thing but I can’t think of a single reason to have 90 degrees of vertical coverage for a stage monitor. In that configuration you’re covering both your knees and the ceiling. Even so there is some logic behind this design decision. It limits the height of the cabinet (what Yamaha calls low profile) and if the SM12V wedge is used as a main speaker on a speaker stand (which the design allows for), the 90 degree side of the horn is horizontal. What is being sold as a floor wedge in a series of speakers has been optimized for use as a main speaker on a pole.
Yamaha SM12V

For a tight patterned floor wedge I would prefer a symmetric horn (40 x 40). One such design is the Meyer Sound UM-1P with it’s 45 x 45 horn. A fantastic sounding stage monitor.
Meyer Sound – UM1P

Having satisfied my desire to tweak the SM12V eq, I moved on to the Rockville RSM15a wedge.

Rockville Audio – RSM15a self powered 15″ wedge

This self powered cabinet provides a 3 band eq as well as a feedback filter sweep on the side of the cabinet. Here is a photo of the control panel taken from the website.
Rockville  RSM15a control panel

The house audio engineer was thoughtful enough to made sure that the various controls on the cabinet were zeroed out before I began to measure it. Our settings were LINE IN, all 3 bands of EQ set for flat, feedback filter disengaged and volume at unity. One would hope that a self powered cabinet with it’s onboard EQ set to flat would measurement relatively flat but no. The design has some undesirable attributes out of the box.
Rockville pre and post EQ
Note the 15db to 18db of extra 2k and 4k. Not something anyone wants unless feedback is the goal. Consequently, it took most of the available filters to tame the response of that box. It’s possible that using the onboard eq it would be possible to flatten out the peaks but I wanted the house audio engineer to know that the wedge is tuned when the onboard controls are all set to unity.

In conclusion, certainly in smaller rooms, stage monitors have just as much affect on the “sound” the audience hears as the main speakers. They are acting together to fill the room with sound. It would be silly to go to the trouble of tuning the main speakers but leave the stage monitors un-eqed. All speakers in a room should be optimized in their active configuration for that venue.

miniDSP – audio DSP for the masses?

For the longest time the market didn’t offer much in the multi channel DSP market. There were $1000+ 2×6 and then 4×8 units that were $3000+. Recently that situation has changed which is good for those of us who want separate control of each speaker in a sound system. Anytime you link speakers together (either at the amp or at the DSP output) you’re giving up the ability to mute, control and optimize each speaker. How does one do a system component check if you can only mute / unmute a group of speakers?

minidsp has a few offerings that allow for some interesting possibilities when it comes to home and even professional speaker processing.

miniDSP 2×4

miniDSP 4×10 HD

miniDSP 10x10HD

Each unit requires a software plugin to allow it to function. Fortunately the plugins are inexpensive and provide a lot of processing functionality.

Behringer ECM8000 warning from Cross Spectrum Labs

I found this information on a 3rd party mic verification and calibration tester called Cross Spectrum Labs regarding the Behringer ECM8000. BUYER BEWARE!!!

cross-spectrum.com – Calibrated Behringer ECM8000 microphones

QUOTE:

Effective immediately, Cross·Spectrum has ceased selling calibrated Behringer ECM8000 microphones. The quality of ECM8000 microphones has deteriorated to the point that we can no longer justify the effort in dealing with non-functioning units or mics with extremely abnormal frequency responses.

BUYER BEWARE!!!

If the reason you are going to use a measurement mic is to make accurate measurements, what good will an inferior mic do to reach that goal? Consider one of the other inexpensive mics on the market with a better track record. For example, Cross Spectrum Labs will verify and calibrate a Dayton EMM-6 microphone.

cross-spectrum.com – Calibrated Dayton EMM-6 microphones

QUOTE:

Calibrated Dayton EMM-6 microphones

We are now selling calibrated Dayton Audio EMM-6 measurement microphones on an ongoing basis.

These microphones are similar (but not identical as you may read on some forums) to the Behringer ECM8000 and the stock units come with on-axis calibration curves.

We provide the following value-added services over the stock Dayton EMM-6 microphones:

The calibration curve provided by Dayton is in the range of 20 Hz to 20 kHz. We provide calibration files (.FRD format) on a USB thumbdrive for use in many popular audio measurement programs. Additionally, our cal files range from 5 Hz to 25 kHz to encompass the low bass and high treble regions that many audiophiles, professionals and home theater aficionados require.

Our own microphone measurements indicate that the data sheets included with the mics may not be representative of the EMM-6’s individual performance. As shown in the second link, our measurement methodology compares favorably with the results generated by a NVLAP NIST-traceable laboratory so you can be confident that your data are reliable.

As with our calibrated ECM8000 microphones, each EMM-6 microphone is calibrated against an ANSI-certified reference microphone. Each microphone will be shipped with the following:

Dayton Audio EMM-6 microphone with windscreen, case, and microphone clip
Microphone characterization report ( “Basic+” sample/ “Premium+” sample) with individually measured on-axis (0°) frequency response
“Premium” calibrated microphones will also include polar response, sensitivity, and noise floor
“Basic-Plus” and “Premium-Plus” microphones include frequency response curves at 45° and 90° angles of incidence
USB thumbdrive with frequency response data (.FRD format) and polar response data (Excel and .CSV formats, “Premium” calibrated microphones only)

Prices start at $75 plus shipping for “Basic+” calibrated microphones. Click the “Pricing” tab for information on domestic and international shipping rates.

Dayton EMM-6 with Cross Spectrum Labs calibration comparison

This is an interesting comparison between and Earthworks M30 and a Dayton EMM-6 that has a calibration file provided by 3rd party tester Cross Spectrum Labs.

hifizine.com – Dayton EMM-6 measurement microphone, calibrated by Cross-Spectrum Labs

Interested in having a mic tested and being provided with a frequency and polar chart as well as calibration files?

Cross Spectrum Labs website

Here is an interesting thread that appears to include comments by Cross Spectrum Labs staff regarding Dayton factory calibration files:

hometheatershack.com – Re:Cross-Spectrum Microphone Calibration Service – USA

Horizontal & Vertical planes

Part of the language of sound system design and optimization has to do with horizontal and vertical planes. What do those terms actually mean?

First let’s visit WIKI:

WIKI – Horizontal plane

WIKI – Vertical plane

WIKI – Horizontal and vertical

Now let’s get into how these concepts relate to sound localization which refers to a listener’s ability to identify the location or orgin of a detected sound in a direction and distance.

WIKI – Sound localization

Now let’s move to the concept of interaural time difference or ITD which has to do with the difference in arrival time of a sound between two ears:
WIKI – Interaural time difference / ITD

FAR – Forward Aspect Ratio

How does one figure out the proper speaker to use for a given design goal?

In Bob McCarthy’s book “Sound Systems – Design and Optimization” on pages 240 through 247 – 2nd edition he explains the concept of FAR (forward aspect ratio).

Saint Andrews part 5

Last night I finally had a break through on this design. The issue has always been that the space is used in two different configurations. With and without a live band. If the design covers all the seating, it will also cover the band when the band is present. Using Google SketchUp, I did a study of a design that will cover all the seats and and a different design that doesn’t cover where the band sets up (mirrored on the opposite side of the venue). One design uses (3) speakers and one design uses (4). The solution (whether it’s the chosen design or not) is a design that has (2) parts to it. The (4) speakers will provide coverage to all seating for general voice (lectern, altar & any wireless mics) while the other (3) speakers will amplify the band instruments while leaving them out of the coverage pattern. This would be considered an A/B sort of design and there are sonic benefits to be had in having only voice is one set of speakers and the band in another set.

The biggest downside I see to this design concept is that it will require more gear (speakers, amps, dsp). There is a chance that having the band located in the coverage zone of the (4) speaker system won’t be an issue so it’s logical to start with the (4) speaker design and add 3 additional full range speakers if necessary.

My original designs were based around Meyer Sound products but the budget for this project doesn’t afford using Meyer gear. Instead I’ve adjusted the design to take advantage of some QSC speakers. Specifically the AD-S12 full range box and the AD-S112SW sub woofer. Both can be mounted on a yoke which simplifies rigging.

Here is a top view of the (4) speaker design that covers all the seating:
St Andrews top view 010916 4 zones with arcs

This is a mock up of what the design might look like installed.
Saint Andrews 4 speaker mockup

Here is a top view of the (3) speaker design that leaves the band area uncovered:
St Andrews top view 010916 3 zones with arcs

Here is a top view of the (7) speakers which would function at the same time but not reproducing the same signals. Voice would go to the (4) main speakers and the band channels would be routed to the (3) band speakers:
St Andrews top view 010916 7 zones with arcs

This is a mock up of what the design might look like installed:

Saint Andrews 7 speaker mockup

Here is a side view to learn if the 75 degree coverage pattern is going to work or not.
St Andrews side view angles 010916
From the side view, it appears that 75 degrees of vertical coverage is going to provide too much coverage but the locations where the floor and back wall intersect with the coverage pattern are at the edges where we can expect to be 6db below the on axis response. Also the back wall is mostly absorptive because it’s the facade hiding the pipe organ which is made of soft material and open wooden framing. 75 degrees speaker will be a huge improvement compared with the existing overhead ceiling speakers.

Ignorance Is NOT Bliss

A thought for 2016. Ignorance is NOT bliss or else I’d be pretty happy at this point.

The more I learn about the acoustic measurement process and system design and optimization, the more I realize how much more I need to understand to be competent. After years of active study, what I’ve become good at is recognizing my blind spots. This can be discouraging but I knew starting this adventure that it wasn’t going to be easy. The tools themselves are now well understood. Now it’s time to get more comfortable with the various procedural routines. This is something that 6o6 McCarthy spends a great deal of time on in his classes but for which I still struggle with. It all seems so simple until I’m standing there with my mics and someone’s system is on the line. The map (if you will) of how you get from point A to point Z in the optimization process is known. Proper system design and optimization must follow a certain set of steps in the proper order or else all the decisions made along the way are invalid. 6o6’s book, “Sound Systems – Design and Optimization” goes into great detail regarding these steps but in some ways the details are overly & yet necessarily complicated. Sometimes it’s helpful to be able to ask a question and get an answer. Having mentors has greatly expanded my knowledge. Thank you to everyone who has texted, emailed and called when I get lost in the gory details…

Acoustic Measurement and Predictive Modeling – roundtable

This is an interesting article that asks various questions of some big names in the industry:

QUOTE:

For answers, Sound and Video Contractor assembled a panel of authorities in the field, drawing representatives from a cross-section of users and manufacturer/developers. Those experts include Wolfgang Ahnert (principal, ADA Acoustical Design), Jamie Anderson (product manager, SIA Software, a division of Loud Technologies), Pat Brown (president, Synergetic Audio Concepts), Bengt-Inge Dalenbäck (owner and software developer, CATT-Acoustic), Kevin Day (senior consultant, Wrightson, Johnson, Haddon & Williams), David Kahn (principal consultant, Acoustic Dimensions), Ted Leamy (director, engineered sound, JBL Professional), Bob McCarthy (president, Alignment and Design), Perrin Meyer (software R&D manager, Meyer Sound), Roger Schwenke (staff scientist, Meyer Sound), and Robert Scovill (concert sound mixer/producer, Eldon’s Boy Productions).

END QUOTE:

creativeplanetnetwork.com – Acoustic Measurement and Predictive Modeling

The very last response is from Robert Scovill which I think is worth a quote of it’s own:

QUOTE:

Scovill: Again, from the perspective of a mixer, I would love to see FFT and spectral analysis built into the onslaught of coming digital console platforms. It will be an invaluable asset for latency measurements within the desk and input and output stage analysis completely integrated to the package. I’ll take all of that you can give me.

END QUOTE:

Indeed. Once we can compare any two signals at any point in a mixing console, we will be able to do things like phase align the bass DI with the bass mic or the bottom snare mic with the top, etc… Then the optimization process will continue from the sound system right into the performance.

Apple Iphone & Ipod audio output measurements

We’re all listening to music on our phones and some of us are even using our phones to play back music over a PA system (preshow music, sound cues, etc…) I was looking for the output impedance specs of an Iphone and came across this measurement information related to the Iphone.

archimago.blogspot.com – MEASUREMENTS: Apple iPhone 4 & iPhone 6 audio output
kenrockwell.com – Iphone audio quality
stereophile.com – Apple Ipod measurements

Sound Devices USBPre 1.5

The first measurement rig I ever saw was based on a Sound Devices USBPre 1.5 audio i/o, Smaart 4.5 & a Josephson mic. This would of been back around 2000.

I was curious as to whether a Sound Devices USBPre 1.5 could be used with modern equipment and the answer is no. The USBPre 1.5 works with specific 32bit OS versions and will not function with a 64bit OS (all the current ones). So if you are using an older laptop that is running XP (32 bit version) or OSX 6 (or earlier), you may be able to take advantage of a USBPre 1.5 on your measurement rig.

sounddevices.com – USBPre 1.5 User Guide PDF

Here is a thread on the Rational Acoustics forum about getting a USBPre 1.5 to work with Smaart:

Rational Acoustics forum – USBPre 1.5 & Windows

Sound Devices USBPre 2

The Sound Devices USBPre2 could be considered an industry standard audio interface for 2 channel measurement purposes. I own so many audio interfaces already that I haven’t really given the USBPre2 a second thought but I’ve recently seen a need for a smaller 2 channel audio i/o that is buss powered and USB based.

Sound Devices USBPre2 panels

sounddevices.com – USBPre2 Fact Sheet PDF

sounddevices.com – USBPre2 User Guide PDF

Of special interest for measurement purposes is the units internal loop through feature. This is a quote from the user guide (PDF page 20).

Sound Devices USBPre2 loop function

“Input 2 Loop Source – Input 2 has an additional source labeled LOOP. This input source does not correspond to any physical connections on the USBPre 2. When LOOP is selected, input 2’s source is derived from the left channel of the computer audio signal (post digital-to-analog conversion). The input 2 Gain Control
affects signal The Output Gain Control does not affect the level of the signal going in to input 2.The LOOP source is useful for test and measurement applications where a reference signal is required to be routed back to an input.”

What this means is that instead of needing a cable to jump from an output back into an input to provide a reference signal that follows the same circuitry and has the same latency as the measurement, select the loop through and no cable is necessary. Many times I have to go hunt for a TRS to TRS cable for this purpose so having an audio i/o with an internal loop through removes one more external element which is always a good thing when seconds count.

Audix TR40 / TR40a comparison

Over the last few years, I’ve acquired (3) Audix TR40 mics and most recently an Audix TR40a (newer model) for use when my Earthworks mics might be damaged or stolen. I was curious to see what differences there are between the two models (if any).

Using a QSC KW122 speaker on a stand for my DUT, I tested each mic in the same position, one at a time. What you will notice is that TR40-1,2,3 are very close in frequency response and phase response.

Here is a trace of the (3) TR40 mics.

Audix TR40 (3) mic comparison

Here there TR40a is added to the overlay list.

Audix TR40 & TR40a comparison

You will note that the TR40a is roughly 3.5db less sensitive than the TR40s. The amount it takes to match the mics. Of special interest is the discrepancy in phase between all 3 TR40 compared with the TR40a.

Audix TR40 & TR40a with offset

Looking at the impulse response between two of the TR40 and the TR40a, they are very different even though the measurement rig is the same. Same speaker, same position, same mic position (+/- 1/4″), same everything. Someone who knows microphone design might immediately know why the TR40a has a phase response that is so different from the other mics.

Audix TR40 & TR40a IR with text

Here is the information I can find on the specs of the TR40 and TR40a.

QSC Ksub versus QSC KW181

I recently found out that a fellow sound engineer has a pair of QSC Ksub (dual 12″ band pass) subs. Owning a pair of QSC KW181 subs myself, I thought I would compare and measure the two boxes.
QSC KSub KW181 comparison
This is a spec sheet comparison of the relevant points.
QSC KSub KW181 spec comparison
QSC – KSub specs
QSC – KW181 specs
This trace is of both subs with the input level set to unity, positive polarity and contour switch set to normal.
QSC KW181 KSub comparison normal
This trace is of both subs with the input level set to unity, positive polarity and contour switch set to deep.QSC KW181 KSub comparison deep
The smaller KSub (2×12″ bandpass) and KW181 (1×18″ front loaded) are for all intent and purpose, matched! I’m not sure if that speaks well of the KSub or poorly of the KW181. The KW181 does play a bit lower but the difference is small. Judging by the manufacturer specs the KW181 should be able to play 5dB louder than the Ksub but I’m unwilling to verifying that claim due to the sacrificial nature of the experiment.

QSC KW181 subs

I just finished a fashion show where I used (4) QSC KW181 single 18″ subs in addition to the venue’s Meyer Sound 700HP dual stacks for low end. During the setup it was discovered that one of the Kw181 cabinets has an issue. Today while I had a few spare minutes, I measured the (3) functional cabinets to verify they match and also as a baseline for verifying the malfunctioning cabinet after it is repaired.

q_spk_kw_181_img_rearlg
q_spk_kw_181_img_frontlg2
q_spk_kw_181_img_lftprofile
QSC KW181 specs
QSC KW181 rear panel

Here are (3) overlapping traces with the mode switch on NORMAL.
QSC KW181 3 normal

Here are (3) overlapping traces with the mode switch on DEEP.
QSC KW181 3 deep

Here is a comparison of the same cabinet with the mode switch in both positions (NORMAL & DEEP).
QSC KW181 Normal & Deep mode

Note that when the polarity switch is reversed, the frequency response (measuring only one cabinet at a time) is unchanged but the phase response has rotated 180 degrees.
QSC KW181 plus & minus polarity

WIKI – Audio Analyzer

This wiki article is totally related and relevant to the conversation of audio measurements. Something has to measure and verify the gear we all use to capture, mix, process and reproduce audio and the tools discussed below cover those needs as well as being able to perform measurements that we would make in the live audio field.

WIKI – Audio analyzer

NTi Audio – webinars on demand

Nti makes portable measurement tools as well as measurement microphones and such.

NTi Audio – website homepage

You may be able to learn some useful stuff from watching this series of video’s even if you don’t have an NTi measurement system.

NTi Audio – webinars on demand

Here is a good explanation of “frequency weighting for sound level measurements”

NTi Audio – Frequency-Weightings for Sound Level Measurements

More NTi FAQ can be found here:

NTi Audio – FAQ

System Design & Optimization versus Existing System Optimization

I recently realized that there are two distinct branches on the live sound measurement tree. The larger and more complicated branch being system design and optimization. What is the smaller branch? Existing system optimization. Depending on the venue and house staff, my “optimization” scope might be as limited as tuning the entire system via the console EQ. In this case, I may end up with a system that doesn’t perform well but not have any other option.

A systems designer that is installing a new sound system typically has the luxury of choosing the location of each speaker (within the restraints of the physical space) dictating where each speaker is aiming and measuring & processing every zone independently. Then taking on a more holistic view of the system and refining further.

When you walk into a venue and they take the L/R out of your console, you make have that much control only. Meaning you will get to optimize the system with your board eq or your own DSP upstream of the house processing. With a more flexible design you may have L/R/Sub/Front Fill/Delay feeds and control of all those zones. All that is great if you have the time to break the system into it’s parts and optimize each piece before recombining it. Based on conversations with world class system measurement engineers time is always a limiting factor. It may even be THE limiting factor. What good is a road case full of optimization gear if it never gets used? None. I probably own a measurement rig now that can cover any gig but have never used it all at one time. Why? Time. Much of what I do at this point as a measurement engineer is voluntary (highy recommended) which typically allows more time than a typical paying gig would. When I worked with Howard Page of Clair Brothers a few years ago he made it very clear that you need to have your rig well put together, labeled and should be able to be up and running in a matter of minutes. Then you need to be able to taken a typical system’s optimization in 30 minutes or less. One of the ways to do this is to avoid wires. Howard’s Smaart rig is based on a Lectrosonics TM400 RF and appropriate measurement mic. With a wireless measurement rig, you can move fast. Especially if you have an assistant that can place the mic and then move it to the various measurement spots for you. That is the roll I played for Howard.

I do not think that the 30 minute target can be achieved without a wireless measurement rig. Let’s say you’re measuring L/R/Sub/FF/under balc delay/ over balc delay which was the case on the gig I worked with Howard on. Even if you skip measuring L or R and only measure one side of the mains, you’re still measuring 5 zones. Some that are a great distance away from others.

Let’s establish a few goals based on my experience working with Howard.

1. your rig needs to be quick and easy to set up. Target time of less than 5 minutes before you can be measuring your first zone.

2. your concept of how to tackle a system needs to be

Bob McCarthy on sound waves – how size and scale affect audio decisions

svconline.com – Bob McCarthy on Sound Waves

QUOTE:

“CONCLUSION

We can’t see the size of sound directly, but there is great benefit to being able to visualize it in our minds. Modern audio analyzers are very helpful in this regard since they show us phase, from which we can find the wavelength. These modern analyzers are the best learning tool to help us to acquire the ability to see sound in the room.”

Bass Performance Hall’s Meyer 700HP & 650P sub details

The house sound system at Bass Performance Hall in Fort Worth Texas includes (4) Meyer Sound 700HP subs located on the deck & (4) Meyer Sound 650P located in side boxes on level 2 and 4.

Meyer Sound 700-HP

Meyer Sound – 700HP data sheet PDF

Frequency Response : +/- 4dB from 30hz to 125hz
Phase Response: +/- 30 degrees from 45hz to 145hz
Maximum SPL: 136 @ 1 meter
Dynamic Range >110 dB

Meyer Sound 650-P

Meyer Sound – 650P data sheet PDF

Frequency Response : +/- 4dB from 28hz to 100hz
Phase Response: +/- 30 degrees from 45hz to 145hz
Maximum SPL: 136 @ 1 meter
Dynamic Range >110 dB

The 700HP setup is a double cabinet stack L/R onstage edge configuration due to the physical limitations of the space. There are also a pair of Meyer Sound 650P (one per side) in box seating area nearest the proscenium on level 3.

add photos

and measurement traces

Arthur Skudra 2015 – first contact

ARthur Skudra is a Rational Acoustics Smaart instructor among other things:

rationalacoustics.com – Arthur Skudra profile

Based on multiple posts to the Rational Acoustics forum Arthur has made on the subject of using Line 6 wireless gear for audio measurement purposes, I emailed him a few days ago to ask him what his current thoughts were. Come to find out he likely has the largest Line 6 measurement rig in the world at 5+ channels. At this point using Line 6 wireless gear for audio measurements is a departure from the industry standard “tried and true” Lectrosonics gear and doing so requires a bit of courage & experimentation to get it all to work. His response was both quick and lengthy, providing all the details one could hope for. I would share the information here and now but Arthur stated that he’s working on an official document on the subject so I’ll let him get that all done and then provide access to that information. In the meantime the good news is that it works (given the right gear and configuration). More soon…

Optimum System Solutions – “Optimization Before Replacement”

Many times I come across PA systems that have potential that was never achieved because it was installed wrong or not tuned correctly (or at all).

It’s refreshing to find an outfit that recognizes this issue and has made it a business model to see if they can optimize your system AS IS before they write up a quote to replace everything (the norm).

Their slogan – “Optimization before Replacement”! What a novel idea…

Optimum System Solutions – about

Here are some documents written by John Murray @ Optimum System Solutions:

Sound System Equalization PDF
Equalization Revisited PDF
Quadratic Horn White Paper PDF

Q versus Bandwidth

This article is worth reading in order to understand the difference between Q and bandwidth when it comes to filter width.

rane.com – Bandwidth in Octaves Versus Q in Bandpass filters

Here is a PDF of the same information:

Rane – Bandwidth in Octaves Versus Q in Bandpass filters PDF

Here are wiki explanations of “Q factor” / “Quality factor” & Bandwidth

WIKI – Q factor
WIKI – Bandwidth (signal processing)

Here is a screen shot of the Rane table for those who want something portable:

Rane - Q to Bandwidth conversion table

Lectrosonics – multi channel RF measurement solutions

Having recently worked with Sound Mirror (a classical recording firm) on an opera production and then installing a new sound system at the Indianapolis Zoo, both using Lectrosonics wireless gear, I wrote the company to ask how I might build a multi channel
measurement rig. Below are the answers I received from John Muldrow @ Lectrosonics. Note that I use Earthworks measurement mics so the list includes the adapter needed to have those work with the HM plugin transmitter.

This is a list of the gear needed which uses the 1RU Venue receiver frame:

QUOTE:

(5) HM plug-on transmitters (specify block)
(5) VRS/E01 receivers (specify block)
(1) VRMWBL mainframe.
(5) MCA-M30 Earthworks Polarity adaptors
(2) A500RA antennas (specify block)

We would recommend block 470, block 19 or block 20. The lower blocks work well around the country so you shouldn’t have too many problems.

END QUOTE:

One could also purchase (5) of the Lectrosonic TM400 measurement kits.

The up side of using the TM400 kits is that you can take as few or as many as you need and each one is discrete. I like the idea of a single rack space receiver and then (5) HM plugin transmitters. Everything could store in a rack drawer including the antennas.

Before you run out and spend the money, consider this. Lectrosonics will be releasing a new hardware series soon (around end of 2015) which might have benefits that we would want. Here are the specifics to built a rig using that gear once it’s available:

QUOTE:

Equipment for Venue2 would be:

(1) VRM2WBL
(5) VRT2
(5) HMA transmitters
(2) A500RA antennas
(5) MCA-M30 Earthworks polarity adapters

The Venue2 and VRT2 modules will start shipping in December.

HMA will possibly star shipping in December as well hopefully.

END QUOTE:

Bob McCarthy explains in his workshop that (5) mics are a minimum to measure a system efficiently. Based on my research on line, street price for a (5) channel Lectrosonics measurement rig based around the Venue / VRS / HM plugin transmitter is around $10,000 not including the mics. Street price for (5) Earthworks M23 measurement mics is in the $2500 ballpark. So for around $12,500 you could join the RF measurement club!

Hopefully Ole Saint Nick will be generous this year to all of us!!!

Coverage Angle – misnomer

The loudspeaker manufacturing industry uses a term that is misleading to describe how a speaker behaves.

That term is “COVERAGE ANGLE”.

WIKI – Misnomer

Anyone who knows how a loudspeaker works can tell you that there is no such thing as a consistent coverage angle for a speaker. The relevant question is “at what frequency?” Otherwise there is no reference point and no useful data to act upon.

Nathan Lively & Daniel Lundberg have provided us with the following:

sounddesignlive.com – How To Find Speaker Coverage Calculator

Waves Sub Align plugin

The announcement for this plugin just landed in my email box.

Waves Sub Align

Waves – Sub Align link

Here is a video that explains how the plugin is used:

Waves – Sub Align video

QUOTE:

Sub Align is a must-have survival tool for any live sound engineer. This plugin lets FOH engineers align sub and top speakers in PA systems where the subs are tied in with the tops, and the system processor is inaccessible. By doing so, Sub Align offers a revolutionary solution to a problem live sound engineers have been struggling with on a daily basis.

The Problem
The physical position of tops and subs and the distance between them are critical for the overall punch and clarity of the PA system. However, most performers and engineers play small and mid-sized venues, where very often the tops and the subs are not properly aligned. In order to clear floor space, the subs are usually stacked at the sides of the venue or all the way in the back, causing the sound to be smeared and unfocused. To make things worse, the system processor is seldom accessible to the live sound engineer, and the PA subs are tied in with the tops.

The Solution
Sub Align puts YOU in charge of the venue’s PA sound with a simple and original solution: by giving you control over the delay between your tops and subs and creating a crossover point between them, it enables you to “move” your subs back or forward in relation to the tops, until you reach the alignment point that sounds best to your ears. No longer do you have to waste precious time fighting unaligned PA systems with EQs and compressors. To achieve extra clarity and punch, Sub Align also gives you control over the subs’ volume and polarity/phase.

Take Control
Don’t let badly aligned PA systems dictate how your mix will sound! Sub Align puts the control in your hands, enabling you to get a clearer, punchier mix no matter what venue you’re mixing in.

END QUOTE

Smaart 7 – Make you own microphone calibration curves

On a recent measurement session taht involved salt water, it was decided to use a Rational Acoustic RTA-420 mic instead of the more expensive DPA4007. Rational Acoustics sells a verion of the RTA-420 mic that comes with a calibration file to load into Smaart. Once done, an RTA-420 provides results as if the mic were perfectly flat.

The RTA-420 mic we had didn’t include a calibration file. How would we calibrate the mic against the DPA4007?

This Rational Acoustics forum thread explains how:

Rational Acoustics forum – Make your own microphone calibration curves in Smaart 7

Indianapolis Zoo – Dolphin exhibit

I just got back from a quick trip to the Indianapolis Zoo to help with some sound system upgrades and to add a video screen and projector.

The sound system consists of the existing EV cabinets that were previously installed by another vendor. We added front fills and delay speakers to cover all the seating.

I’ll add specifics later but in essence we had (4) piece to put together.

There are (4) QSC speaker on each side of the Dolphin pool separated by the slide out for a total of (8) front fills fed as two zone via 70v amp.

There are (8) QSC speakers near the ceiling covering the highest 5 rows of seats. (2) zones.

There are (4) EV mains & (2) EV subs.

We discovered that the EV speakers were NOT EQ via the EV DX-38 DSP unit. All EQ on the existing system was bypassed. Just by tuning the existing system, the venue was upgraded to useful status. The EV cabinets used for mains were not able to cover enough territory by themselves but with the addition of front fills and delays, the current system is surprisingly good.

We equalized the front fills & delays using the built in DSP on the QSC CDX 4.3 amp.

How to build an adapter to match a Shure SM57 / SM58 to modern mic preamps

This past weekend I mixed FOH audio for “Live and Let Die – A Symphonic Tribute To the Music of Paul McCartney & The Beatles” with the Fort Worth Symphony Orchestra. I made the mistake of using SM57s on the trumpets and trombones. I say “mistake” because it was very difficult to get what I needed using those mics. The rest of the orchestra was mic-ed with condensor mics with the exception of the brass (including horns).

The Shure SM57 & SM58 were both presenting to the audio world back in the 1960s when tube mixers were still in wide use. Both mics use the same capsule and have the same transformer. The real difference between then being the metal windscreen screwed onto the SM58 to make it more robust for vocal purposes.

I came across this article which explains how preamp designs have changed over the years but in doing so have left the SM57 / SM58 mics at an impendance disadvantage.

recordingmag.com – Shure SM57 Impedance Modification

The gist is modern preamps have standardized on an input impendance between 1500 & 2000 ohms which isn’t a good impedance match for dynamic mics which operate more efficiently driving in input impedance of around 500ohm.

Fortunately, using some inexpensive parts, one can build an XLR adapter than resolves the impendance mismatch.

How to measure and optimize your car stereo – part 1

IF a car stereo provides an AUX input, it’s possible to measure the car stereo and even optimize it. My first experiment will be on a 2005 Scion XA with an aftermarket Kenwood KDC-X494 receiver.

Kenwood KDC-X494 car stereo PDF manual

The specs for the Kenwood KDC-X494 states that is has (4) x 50watts in the amp section.

The car I will be doing the measurement on (the venue) is a 2005 Scion XA.

Kenwood KDC-X494

In order to make useful measurements, we need to be able to get a signal into the car stereo that we are generating from our measurement rig. In this case, that is what the AUX input on the car stereo is for. We’ll inject pink noise into the car stereo, use our measurement mic to measure the result and via the onboard DSP, adjust the EQ settings until we have a car stereo that is as flat as possible.

The AUX input I’ve seen on car stereos is a 3.5mm TRS female jack (also called 1/8″ TRS or 1/8″ stereo jack). We will need a 1/8″ stereo plug that adapts to something that can mate to the outputs of our audio interface. It’s fairly common to convert 1/8″ stereo to dual RCA on the other end. From there we can add RCA female to male 1/4″ and plug in to the outputs of an audio interface. Note that by doing this, we are “unbalanced” the signal but in this case is shouldn’t matter. Here is a photo of the necessary cable and adapters.

1/8" stereo to dual RCA with RCA to 1/4" adapters

The car stereo I am working with is a Kenwood KDC-X494. The unit has a surprising amount of DSP for EQing the system. Here are the specs for the DSP EQ section.

Kenwood KDC-X494 car stereo audio control settings

Part of optimizing a sound system (in this case a car stereo) is to know what the various components in the system are, how they function and how to manage them. Consequently, today I did some recon on what speakers are installed and where in the vehicle. There are full range speakers mounted in all (4) doors located near the bottom panel.

Scion XA woofer front

Scion XA woofer rear

There are (2) tweeters mounted on the front doors near the dash board.

Scion XA tweeter

Now that we have gathered the basic information needed, we can begin to measure and then optimize the car stereo. Visit PART 2 for the results…

Doc Severinsen’s Sennheiser MD441


Tomorrow night, I’ll be mixing FOH sound for Doc Severinsen and the Fort Worth Symphony Orchestra. Doc brought his own personal Sennheiser MD441U for this show (his preferred trumpet mic).

square_louped_md_441-u_01_sq_vocal_sennheiser

Sennheiser – MD441U
Sennheiser – MD441U PDF manual

For this show he actually needs a second trumpet mic but the house doesn’t own an MD441U & neither do I. ???

I volunteered to measure Doc’s MD441U in the morning and process one of my Earthworks SR30 to have the same frequency response for his second trumpet position. While this is not an ideal solution for many reasons (some technical and some emotional), I think we can get close enough to make him happy. He’s a very warm and friendly fellow in case you’re wondering. I spoke into his MD441U and my first reaction was how bass heavy it was. This might be the reason why he likes the sound. Because it “warms” up his trumpet. We’ll know soon…

How does one match one mic to another? The same we would match the frequency response of one speaker to another but with two mics and one speaker instead of one mic and two speakers. We will need our measurement rig (laptop, audio interface & FFT software), a sound source with the ability to cover the basic frequencies the MD441U is able to reproduce, Doc’s mic & my Earthworks SR30. This will be a very simple procedure.

Send pink noise through speaker & measure with MD441U
Save measurement trace
Replace MD441U with SR30 and match levels
Compare FR of MD441U trace with SR30 trace
Perform complimentary / corrective EQ on the SR30 to have the same frequency response of the MD441U.
Save EQ trace and paste on the second input channel strip
Bypass EQ on first input channel strip and put the MD441U back where it was.

Photos to come…

Shure SM57 versus SM58

I was looking for the frequency response of both the Shure SM57 and SM58 to add to a growing PDF library of mic specs and saw this forum thread comparing the two mics.

Shure – SM57 versus SM58

QUOTE:

“The SM58 and the SM57 share the same mic element, the Unidyne III. The only difference between the these two models is the grill design.

The grill design does affect the high frequency response, particularly above 8,000 Hz.

The SM57 grill design allows more proximity effect because the mic diaphragm can be placed closer to the sound source. Proximity effect increases each time the distance from the mic to the source is halved. When a mic is placed very close, it is quite easy to halve the distance: 1 inch to 1/2 inch; 1/2 inch to 1/4 inch; etc. Remove the ball grill from the SM58 and it will be more similar to the SM57 in its low frequency response.

Any other differences you hear between the SM57 and SM58 are likely to be subjective (psycho-acoustic) or due to slight manufacturing differences due to part tolerance. ”

END QUOTE:

This should be something easy to see when measuring an SM57 against an SM58 with it’s ball windscreen removed. More soon…

National Cowgirl Museum – Wild West gallery

The National Cowgirl Museum recently updated the main gallery on the first floor and in doing so has a new sound system. The system is made up of

Peavey Digitool MX32 DSP

QSC CX168 – 8 channel power amplifier

There are (10) miniature speakers (models to come) located through out the exhibit space.

Innovox – MLA-16 micro line array

& (5) Micro subs

Innovox – Micro Sub 6 IW (in wall)

(5) of the speakers are reproducing the voice of “Annie Oakley”. The rest of the speakers are reproducing a soundscape that accompanies black and white footage of the Wild West show captured at the end of the 1800s and early part of the 1900s. In a museum, sound is always a concern. Rarely are museums acoustically friendly to amplified sound. In the case of the new gallery, the air handler system has already pushed the noise floor up high enough where I am concerned that even with speakers that are aimed optimally and processed correctly, it’s still going to be difficult to find a balance between too loud and too soft. The noise floor is just too high. I noticed that today, if you’re standing at one of the Annie Oakley hologram exhibits and someone is talking, it’s difficult to hear the dialogue. If we set the dialogue to be loud enough to be heard over talking, it will likely seem too loud when no one is talking. If we set it when no one is talking it will likely be to quiet when someone is talking. Consequently, speaker placement and aim is all the more critical. Today I met with the designer to discuss moving the speakers down lower and more on the same plane as the visual element. AS IS, the audio is already coming from almost directly overhead which is a bit disconcerting when you are watching one of the Annie Oakley holograms speak. Also some of the speakers have mounting brackets that don’t allow for proper aim. I went to the museum this evening to swap out the 1.5 inch “L” mounts for 2 inch “L” mounts. Now the speakers are completely aim-able.

Each of the Annie Oakley speakers is in a different acoustic space. They’re all mounted to a wall but (2) are fairly clear of nearby objects, (2) are fairly close to glass display cases & (1) is mounted on the wall up against the ceiling. Logic would suggest that the one mounted next to (2) boundaries will have more inherent low / low mid content which it does.

The long term goal is to relocate the speakers to be lower on the walls. With a pending grand opening on Thursday, to make sure that all the speakers are aimed correctly to avoid spilling into other parts of the space. Also each speaker should be processed (EQ) to be flat so there is not a build up of low / low mid energy which is omni directional. The end result is that Annie Oakley’s voice sounds natural and the soundscape is a bit subdued in the vocal range to leave room for hearing the dialogue. photos and traces to follow.

Cardioid explained

I was just revisiting microphone polar patterns and thought I would share. In live audio reinforcement, a cardioid mic has and will continue to be king. For audio measurement purposes, an omni directional mic is necessary due to the way it mimics the human hearing response. What does cardioid mean?

WIKI – Cardioid

QUOTE:

A cardioid (from the Greek καρδία “heart”) is a plane curve traced by a point on the perimeter of a circle that is rolling around a fixed circle of the same radius. It is therefore a type of limaçon and can also be defined as an epicycloid having a single cusp. It is also a type of sinusoidal spiral, and an inverse curve of the parabola with the focus as the center of inversion.[1]

The name was coined by de Castillon in 1741[2] but had been the subject of study decades beforehand.[3] Named for its heart-like form, it is shaped more like the outline of the cross section of a round apple without the stalk.

END QUOTE:

In case you chose not to visit the wiki article, at least click on the image below and watch how the cardioid shape is traced…

Cardiod_animation

Can you say spirograph???

WIKI – Spirograph

With regards to microphone polar patterns we have a few basic polar shapes to choose from.

Omni directional
Cardioid.
Bi Directional / Figure 8

We get different polar patterns landing in between those basic polar shapes by combining them.

WIKI – Microphone

Quote:
A cardioid microphone is effectively a superposition of an omnidirectional and a figure-8 microphone; for sound waves coming from the back, the negative signal from the figure-8 cancels the positive signal from the omnidirectional element, whereas for sound waves coming from the front, the two add to each other. A hyper-cardioid microphone is similar, but with a slightly larger figure-8 contribution leading to a tighter area of front sensitivity and a smaller lobe of rear sensitivity. A super-cardioid microphone is similar to a hyper-cardioid, except there is more front pickup and less rear pickup. While any pattern between omni and figure 8 is possible by adjusting their mix, common definitions state that a hypercardioid is produced by combining them at a 3:1 ratio, producing nulls at 109.5°, while supercardioid is produced with a 5:3 ratio, with nulls at 126.9°
END QUOTE:

I think it helps to see a graphic representation of the various polar patterns in order to understand why you would use one type of mic over another.

Polar_pattern_omnidirectional

1024px-Polar_pattern_subcardioid

1024px-Polar_pattern_cardioid

1024px-Polar_pattern_supercardioid

1024px-Polar_pattern_hypercardioid

1024px-Polar_pattern_figure_eight

1024px-Polar_pattern_directional