Sound Systems – Design & Optimization 3rd Edition

After waiting for what seems like an eternity, Bob “6o6” McCarthy’s, “Sound Systems – Design & Optimization – 3rd Edition” is finally available!
Sound Systems - Design & Optimization 3rd Edition small
Considering how vital this book will be to anyone interested in system design and optimization, I have arranged for visitors to be able to buy the book directly from the publisher via a 20% discount code. If you do purchase from the publisher, I’d be curious to know what it ends up costing by the time you pay shipping charges. The discount code is “SSD20” and you will enter it at checkout.
Sound Systems – Design & Optimization 3rd Edition
A note from the publisher. “This offer cannot be used in conjunction with any other offer or discount and only applies to books purchased directly via Routledge.com”

Read the first 61 pages for free here:
Sound Systems – Design & Optimization 3rd Edition – intro, Chapter 1 & part of Chapter 2

If you want to purchase the book from Amazon:
“Sound Systems – Design & Optimization 3rd Edition”

MISD 2016 – Texas Ballet Theater’s Peter and the Wolf production

I spent the last two days at Mansfield ISD Center for The Performing Arts in Mansfield Texas with Texas Ballet Theater doing our yearly production of Peter and the Wolf for ISD students.  Always a pleasure.

During this stay, I learned that the sound system was designed by BAI of Austin.

http://www.baiaustin.com/#!untitled/zoom/c1lxh/image1ehk
http://www.baiaustin.com/#!untitled/zoom/c1lxh/image10gt


Meyer Sound SIM3 Remote

Having spent a day working with SIM3 and not knowing how to get my measurements off the machine so I can post the results, I checked with 606 who provided the following details via text.


Option 1) file: screen dump – makes a .bmp Then you have to burn a CD-R to get it out.
Option 2: SIM Viewer
Option 3 : run SIM on VNC viewer and screen grab from there

Choosing the path of least resistance, I choose option 3. How???

I wrote Meyer Sound tech support and this is the reply:

“Hello,

Here is some information that I have for SIM3 Remote. I’m not sure if the link to
download the .iso file will work for you or not. If it does not, let me know and I
will get it to you in another way.

Here is the final version of SIM3 Remote with a full time working vnc and sftp
server, with a working permanent installer.

This version will allow you to be Local and remote at the same time.

For training purposes this will allow to download SIM3 Remote Installer ISO

In order to connect to the remote SIM please use the VNC viewer from Real VNC.

Download VNC Viewer

Here are the VNC viewer configuration parameters…

VNC Viewer Set-up 1

VNC Viewer Set-up 2

VNC Viewer Set-up 3

You will need a keyboard, mouse and screen for permanent install… otherwise just put
in the CD into the SIM3 unit and wait for it to start booting from the CD. The
default IP address will be 192.168.1.160, but you can permanently install it to any
other IP address

You will, once the installer completes (you will see the command prompt), need to
reboot the machine and remove the CD.

If you have SIM3 remote installed to the SSD of your SIM3 machine when booting up
please just wait until booting completes and you will have both the local version
and multiple remote versions available.”

Acme Professional Inc – Meyer SIM3 / DPA rig for sale

To whom it may concern, Tom Clark of Acme Professionals has a Meyer Sound SIM3 3022 Audio Analyzer system for sale that includes (2) SIM-3081 Mic switchers and (1) SIM-3088 Line Switcher. The kit also includes multiple DPA 4091 measurement mics, misc cabling and road cases. Interested parties should contact Tom directly.
Tom Clark - Acme Professionals Inc
In case you’re not familiar with Acme Professional and Acme Partners,
acmesoundpartners.com – projects
acmeprofessional.com – projects
Acme Professionals SIM3 front side view
Acme Professionals SIM3 front view
Acme Professionals SIM3 front view with monitor
Acme Professionals SIM3 rear view
Acme Professionals SIM3 DPA kit
Acme Professionals SIM3 top view with monitor
Acme Professionals SIM3 fan in
Acme Professionals SIM3 fan out
Acme Professionals SIM3 case
Acme Professionals SIM3 mics and cable pouches
Acme Professionals SIM3 roadcase

Temperature / Period “Time” / Frequency / Wave Length / Note ID

In my opinion, when it comes to a complicated system, more information is better than less information. This goes for a simple computer, car dashboard, airplane control panel and certainly a measurement rig. When you are presented with related data such as the outside temperature in Fahrenheit and Celsius you begin to learn how they relate to each other. Not true if you are using only one temperature scale. Since temperature affects sound, we should understand temperature scales.

Celsius = -17.7778 / Fahrenheit = 0
Celsius = 0 / Fahrenheit = 32 (freezing point of water)
Celsius = 37 / Fahrenheit = 98.6 (average temperature of a human)
Celsius = 37.778 / Fahrenheit = 100
Celsius = 100 / Fahrenheit = 212 (boiling point of water)

The Fahrenheit temperature scale seems to be more useful for discussing human environments as 0 degrees is pretty cold and 100 degrees is pretty hot.

Celsius is the perfect temperature scale to discuss different states of water. 0 to 100

But knowing both scales and how they relate to each other is obviously a superior approach than choosing only one or the other. The same is true for audio. It’s vital that we can think in period (time), frequency (Hz) and wave length (distance) if we’re going to see “the big picture” as it relates to the data a measurement rig provides. I’ll add onto that list of related values the note ID since most of us in the professional audio industry are working in music. If our measurement instrument can provide us with all of those at the same time, obviously the relationship between them all becomes much clearer over time. In that way we quickly learn that a 1k frequency is approximately 1.1 feet long. Then logic can fill in the blank that a 10k frequency is approximately .11 feet long and 100hz is 11.1 feet long. Going further, 500hz is 2.2 feet long, 50 Hz is 22 feet long & 5k is .22 feet long. Ad infinitum.

Once you recognize the relationship between a frequency, wave length and period, it’s much easier to recognize trends on your measurement rig and to anticipate how one decision will affect another. Audio measurement 101 is learning the tools and understanding what the instrument is telling you. Audio measurement 102 is about anticipating what the instrument should reveal and understanding what is going on if it doesn’t. As 6o6 stated in his class, he places his mics where he wants to see something, not the other way around. Meaning you put the mic where you want to measure and then aim the speaker at the mic. When the mic measurement shows the expected result, you’re properly aimed. Makes too much sense!

Here is a calculator for converting between decimal feet and fractions of feet.
daveosborne.com – decimal feet

Dave Lawler’s SIM3 rig – day 2

Possessing a Meyer SIM3 rig is the first step to using a SIM3 rig but unlike a laptop / Smaart rig which gets used for lots of other things like email, Qlab programming, etc… SIM3 serves no other purpose other than measuring audio. Duh! I have been in possession of the rig now since Sunday and I still haven’t made a single measurement. Why? Because I have to find a place to set it up. This no fault of SIM3 but where as I can measure with my laptop while I’m getting other work done, SIM3 is going to require learning the interface, keeping it in one safe place, etc… Maybe this afternoon I can find that place and get it setup.

Crown TEF

I was reading a forum thread about an unnamed speaker manufacturer that still uses a TEF analyzer and thought I would read about the device.

Unfortunately I can’t find a wiki article on TEF but here is some basic information:

TEF stands for “Time / Energy / Frequency Analysis”.

“TEF is the invention of Richard C Heyser, TEF was brought out of Richard’s lab and into the world by Don Davis of Altec and our friends at Crown Audio.

Richards brilliance was brought into the audio world in 1967? when a paper submitted by him on a new (his) audio measurement method was discovered in a trash can of the AES by none other than Harry F Olsen.”

It just so happens that there is one for sale on eBay right now which provides an opportunity to see what one looks like.

Crown TEF 4

Crown TEF 3

Crown TEF 2

Crown TEF 5

Crown TEF 1

Crown TEF 6

The only modern TEF system I can find is produced by Gold Line:
gold-line.com TEF webpage

mcswaured.com – TEF

Dave Lawler’s SIM3 rig – day 1

I was talking with Dave Lawler the other evening via telephone about my interest in spending some time with a Meyer SIM3 measurement rig and it just so happens that his SIM3 rig was left at Winspear Opera House in anticipation of his next visit to the venue. Dave is graciously loaning it to me for the moment and I collected it this evening from the venue and took it back to the shop to set it up and make sure it works with the VGA monitor I have. It does! Until Dave asks for it back, I’m going to learn everything I can about SIM3.

Dave Lawler SIM3 rig

Now if I only knew what to do with it…

Here is the SIM3 documents page on the Meyer Sound website:
Meyer Sound – SIM3 documents

One of the things that I want to figure out is how to take screen shots of the data provided by SIM3 so I can share it here. Do you know how? Contact me…


Rational Acoustics RTA420 mic with calibration file

If you can’t afford a high quality measurement mic (meaning a mic with a flat frequency response), an inexpensive path to getting something you can trust for Smaart use is Rational Acoustics RTA420 mic.
ra-420_mic_web_1rta420resp
An RTA-420 mic does not have a flat response but if purchased with the calibration file option, Smaart allows the user to load the calibration file into the app so that the frequency response of the mic is corrected.
This is a link to the RTA-420 mic without calibration file:
RTA – 420 measurement mic
This is a link to the RTA-420 mic with calibration file which has been serialized, measured in a lab to provide the file.
RTA – 420 measurement mic with calibration files
If you’re going to purchase an RTA-420, definitely pay a little extra and get the version with a calibration file.

ra-420_case_web_1 ra-420_all_web_1


I will post more details about the calibration process and show the with and without calibration file loaded results.

More soon.


Smaart 8 – Everything you may want to know

The release of Rational Acoustics Smaart 8 is a major event in the audio measurement world. I upgraded my V7 license a few days ago and already prefer V8. So what is different?
rationalacoustics.com – V8 New Features Overview PDF
What does it cost to upgrade from older versions of Smaart?
rationalacoustics.com – V8 Pricing
How about the Smaart 8 user guide or licensing guide?

rationalacoustics.com – V8 Documentation
V8 facts:
rationalacoustics.com – V8 FAQ

Bandwidth in Octaves Versus Q in Bandpass Filters

In order to correctly set complimentary eq curves for speakers you need to be able to find the appropriate frequency center and then adjust the bandwidth.

Bandwidth is adjusted in two formats depending on who is providing the EQ. Octave and Q. These two terms are related but not the same. In order to use them you should understand their relationship.

WIKI – Bandwidth
WIKI – Q factor

Here is a Rane article written by Dennis Bohn on the matter:
rane.com – Bandwidth in Octaves Versus Q in Bandpass Filters
Here is the PDF version of the same article:
rane.com – Bandwidth in Octaves Versus Q in Bandpass Filters PDF
Here is a spreadsheet that coverts from one format to the other:
rane.com – Bandwidth vs. Q Calculator

How to set up Smaart to act like SIM3

A fellow system engineer and mentor of mine uses SIM3 exclusively for measurement purposes and prior to that he used SIM2. It just so happens that his SIM3 rig is in town after a previous measurement / tuning session and he’s arranged for me to borrow it until it is needed on the next job. So soon I will have a SIM3 rig sitting in front of me side by side with Smaart 8.

Who would know better than Jamie Anderson at Rational Acoustics how to configure Smaart to function like SIM3? So I asked the question and here is his response:

“I would set up an eq driving a speaker.
Grab three measurement points. EQ in, EQ out and the measurement mic.

Set up three TF’s:
Room, EQ and Result where:
Room = EQ out vs. Mic
EQ = EQ in vs. EQ out
Result = EQ in vs Mic

Set averaging to 3sec
Set averaging of EQ to 4 FIFO
Set EQ to graph inverted

show plot view as Mag/Mag (view #5)

Display Room and EQ TF’s in upper plot (plot 1)
Display Result TF in lower plot (#2)

That will give a standard SIM view.”

Next week I’ll have a chance to do exactly this and see how it works out. More soon.

Trinity Episcopal Church – parish sound system

I recently began the process of relocating (2) QSC K8 speakers in Trinity Episcopal Church’s parish hall to cover the room on a different axis.
QSC – K8
What was previous a L/R rig facing West will be a mono main / mono delay rig facing North.
Trinity Episcopal Church speaker position before
Custom mounting brackets were required to mate with the existing structure. Special thanks to True @ Toby Speakers for welding them together for me.
tobyspeakers.com
Trinity Episcopal speaker brackets
Trinity Episcopal speaker brackets painted
The “delay” speaker will be delayed to time align with the main speaker.
Trinity Episcopal Church speaker position after
After finishing the wiring install and landing everything on the Yamaha 0/1V mixer, it was time to EQ the system and then set the delay time for the delay speaker. As is typical, the system without any EQ was excessive in the low mid frequency range. Here is what the single main speaker measured like on axis.
Trinity main no eq without blanket on table You will notice that there is a strong reflection which is due to the table in between the speaker and the mic. So I went and found a blanket and threw it over the table. This is the measurement now. Notice how coherence has greatly improved and the frequency response has changed.
Trinity main no eq with blanket on table
This is the response of just the main speaker pre and post EQ. Trinity main no eq  & eq 1 I’m using the stereo L/R to feed the two speakers so there is no way of having an eq setting for the L output and a different eq setting for the R output. The speakers match and are in roughly the same acoustic space. Hopefully they will work well with the same EQ. Here are the two measurements.
Trinity main and delay eq 1 Next was to measure the main speaker at the transition zone between the main speaker and the delay speaker to get a base delay time. Then to measure the delay speaker to get that delay time. Obviously in this situation the delay speaker is going to be closer to the mic than the main speaker and so the delay speaker will need to be delayed. In this case the delay time turned out to be 16.1 ms, the difference between the main and delay speaker due to location. If the main / delay speakers are arriving early in comparison to the typical presenter location, we will delay both speakers back to the TV on the wall which will also help the imaging when a person is speaking into a microphone.

Arthur Skudra – how to setup a measurement rig using (2) Roland Octa-Capture

Trust me, measuring with multiple mics is addictive. Once you’ve used more than one mic for measurement purposes you immediately understand why having multiple mics is so helpful and saves a lot of time. On my last measurement process I used (7) mics which made it obvious that having even more is better. 6o6 has suggested to me that a 16 mic measurement rig is ideal.

How does one build a 16 mic measurement rig? For starters you need an audio interface with 16 mic inputs which is a rare bird. You can build one from 8×8 devices that include ADAT i/o but one must remember that there is a bit of latency involved any time you use a digital connection between boxes. As long as you stay on top of that, there is no reason it shouldn’t work. The more I measure the more I realize that “acceptable” and “ideal” are far apart and ignoring budget restraints, “ideal” is the target. Why? Time. In the world of professional audio where there are a chance for a loss of ticket sales or corporate accounts, time is money. If you can’t get the system up and running in the time you have, get faster! The element where I see speed greatly achieved regards RF based measurement. There other element is multiple mics. Put the two together and I think we have achieved an “ideal”.

One system engineer I know is doing just such things. Arthur Skudra has been invaluable in my pursuit of these two audio measurement elements (multiple RF mics) so it is not surprising that he has gone out of his way to make sure others have access to the same information he has learned.

This Rational Acoustics forum thread reveals how to take (2) Roland Octa-Capture audio interfaces and build a 16 channel measurement rig.
rationalacoustics.com forum – Why just settle for ONE Octacapture
Roland octa-capture front
Roland octa-capture back
http://www.rolandus.com/products/octa-capture/
One of the things Arthur shares in this forum post is how he measures impedance of each speaker using a Dayton Audio DATS rig.
http://www.daytonaudio.com – DATS audio test system
A follow up with Arthur reveals that he’s now using a NTI MR-Pro for impedance measurement purposes.
ntiaudio.com – Minirator MR-PRO
Note that you also need the 70v/100v protective adapter kit to perform impedance tests.
ntiaudio.com – MR-Pro 70v/100v protective adapter PDF

THD

WIKI – Total Harmonic Distortion / THD
ap.com – THD+N

tungsol.com – Why is there a difference in Tube and Transistor sound

In the heyday of tubes and transformers, a certain amount of distortion may of been desirable but certainly not in the modern day of digital mixing consoles and digital signal processors. Unlike analog tape and analog circuits, most digital audio is a stream of 0s and 1s (binary). There is nothing to be gained by clipping one or more of these devices in a signal chain but ugliness.

Case in point. Recently while performing some electronic measurements on a Soundcraft Vi6, I tested the threshold of clipping going in and out of the console to learned whether or not the red light on the input / outputs comes on at the same time or not.

Why mics are used to enhance a pit orchestra for the stage and audience

There are two good reasons to mic the instruments in a pit. For one, anytime there is a need for putting the musicians in a pit there is obviously something on stage. It could be a broadway musical, ballet, opera, etc…

Some “purists” would suggest that there is no reason to mic the instruments in the pit but they would be misinformed.

Unlike an orchestra shell / reflector setup that is designed and used to enhance the acoustic instruments on stage, a pit is neither. A pit is a compromise of space versus audience seating. A pit is neither acoustically similar to an orchestra shell but is in some ways a worst case scenario. For anyone but the front few rows, there is no direct sound to be had from the pit because of the pit rail and the stage extending out of the pit. There is a window of direct sound to be had but it’s not available until you get up into the balconies. What this means is that a patron seated on the orchestra level (other than the first few rows) are hearing reflected sound only. None of which is imaging sonically to the pit. Instead the reflections may be coming from the ceiling which may be as far away as 100 feet. A round trip up and down again could be 200ms (a 1/5 of the second) and suffer significant air loss along it’s journey. In sound design terms this situation would be completely unacceptable but for the “purist”, that is acceptable and preferred. Ignoring the matter of reflected sound versus direct sound (what the front rows get), there is the matter of the inverse square law which states that the sound level drops by 1/2 with each doubling of the distance from the sound source. Ignoring boundary effects, what this means is that in a typical concert hall, what may be acceptable as a sound level near the pit is completely unacceptable in the upper balconies. Industry standard for level variance is =6db. This means that in general, every seat should be covered in such a way to have a variance of -6db. If the front row is our 0db reference (closest to pit), the furthest seat in a venue should be no less than -6db (1/2). Acoustically and physically, this is impossible but easily accomplished with a well designed sound system. For reference, I recently worked in a venue that measures roughly 150 feet to the furthest seat from the stage. What sort of level could one expect to experience siting in that seat if there is only acoustic sound coming from the pit? Let’s assume that the person sitting on the front row in the very center of the venue is 4′ from the conductor & first violin. What they are hearing is our 0db reference. Looking at the following chart, as we travel 16′, 32′,64′,128′, etc… we quickly move out of the “acceptable” realm of sound system design. The -6db window. By the time we get to the far upper balcony, the level has been reduced by at least 30db.

Inverse Square Law in action pit

In any sound system design, there would be speakers that are involved to provide coverage in the furthest seats. In the case of an all acoustic pit orchestra, those sitting in the furthest will have a completely different experience than those who purchased seats near the pit. I have recently heard the argument that people should get good seats early and those that get poor seats can just suffer. I agree with this concept IF the seating is defined as good and poor and everyone is told in advance of purchase that some seats are inferior to others, anyone who chooses a poor seat shouldn’t expect the same experience as someone who paid more and has a good seat. We all know this is NOT how things work. Instead there are expensive seats and less expensive seats but no one expects to be unable to hear just because they have a less expensive seat. Consequently, it’s the job of the venue / sound system designer / production sound designer to make every attempt to make sure that every seat in the venue fits within the previously stated goal of a 6db window of variation.

In an acoustic space, not only is there the matter of a loss of level per doubling of the distance but also air loss which reduces high frequencies and then boundary effects which enhance low frequencies but don’t help the lost high frequencies. “Muddy” is an appropriate term for what to expect in the far seats of a concert hall when listening to an orchestra in a pit without some sort of “enhancement”.

In summary, there are (3) concepts that should be considered regarding whether there is a need for enhancing an acoustic event.

1. Loss of level due to distance
WIKI – Inverse Square Law
sengpielaudio.com – square law calculator
hyperphysics.phy-astr.gus.edu – inverse square law
hyperphysics.phy-astr.gus.edu – Estimating Sound Levels With The Inverse Square Law
acousticalsurfaces.com – Inverse Square Law

2. Air loss due to distance
sengpielaudio.com – sound distance calculator

3. Boundary Effect – explanations

SYN AUD CON – How Boundaries Affect Loudspeakers – article
SYN AUD CON – How Boundaries Affect Loudspeakers PDF
Sound On Sound – All About The Boundary Effect
argen.com – Is Speaker Boundary Interference Killing Your Bass?
audiomasterclass.com – How A Boundary Mic Gives Crystal Clear Sound

A rule of thumb regarding loss from distance is that 10x the distance will result in a loss of 20db. If 4 feet is your 0db reference point, 40 feet will be -20db.

Owning a tool doesn’t make it useful

A hammer is a fairly self explanatory tool. Same goes for a screw driver. Most tools are easy to understand and use properly. An audio measurement rig is not one of them. An audio measurement rig must be assembled and then maintained. An audio measurement rig is more like a scientific tool than a construction tool. You don’t build things with an audio measurment but instead you use it to optimize and then check your work. In order to do so, you need a broad understanding of not only the art and science of sound systemdesign but the tool itself. One of the benefits of Meyer Sound’s SIM is that the tool is purpose built and self contained. You plug your mics into the device and an feed the output to a console, system, etc… With SIM everything is labeled.

On the other hand, with audio measurement software that runs on an off the shelf computer (Smaart, SpectraFoo Complete, Systune, etc…) you have to have do everything yourself and keep track of what is what. In theory there shouldn’t be much difference between SIM3 and Smaart but there is. Both tools have their benefits and downsides. SIM is expensive, relatively heavy and somewhat fragile. Not a good combination for tossing in your backpack as you get on a plane.

Even so, if money grew on trees, I’d have a SIM rig sitting next to my Smaart 7 rig. I believe that having to choose one tool over another is short sighted. Hammer or screw driver? Roofing hammer, finish hammer or rubber mallet? Each tool does things a bit differently and offers a different perspective on the same thing. For example, SpectraFoo started out as a Pro Tools plugin and has retained that aspect of it’s functionality but added some tools that are useful for live audio purposes. Consequently, I am fortunate to own SpectraFoo Complete even though I think that Smaart 7 is a more useful transfer function tool. I like them both for different reasons. Having more than one measurement tool allows for verifying the tool itself. If I measure with Smaart and SpectraFoo Complete and get the same results, I can be confident that my rig is working. Transfer functions are not terribly complicated to understand but without that understanding, there is little chance of stumbling onto the answers. I was provided with Smaart 4.5.1 back in the 2001 and never got past playing with the RTA function. I had no idea what a transfer function was. It was not until I saw a system designer use transfer functions and had them explain the details to me that I was sold on investing the time and expense into getting an up to date rig and learning how to use it. I know of others who have the tool but don’t really understand why it’s so valuable or what to do with it. The purpose of this website is specifically to address that situation. I may not be able make a horse drink the water but I can certainly lead it to the river and show it how. If you’ve got the tool but haven’t made the leap into using it in your daily audio work, now is the perfect time!

Bruce Wood Dance Project studio A – (4) QSC K10

There is a special event coming up at the new Bruce Wood Dance Project studio this coming weekend and the installed pair of QSC KW10s were located 90 degrees off axis of the audience. There is also the matter of mains / monitors which ideally would be aimed in opposite directions. How do you do a stereo mains / monitors with (2) speakers? You don’t. You need more speakers. On Friday the organization purchased two more QSC K10 and yokes and tonight I installed them. Two aiming forward toward the audience and two aiming backward toward the dance area.
QSC – K10
Bruce Wood Dance Project studio 101
There are only (2) drive lines going into the ceiling area at this point so for now HL Main is jumped to the rear facing SR monitor (same signal). What this means as far as the measurement process goes is that I can’t turn one or the other off without a ladder. Fortunately I want to see how they work together since that will be the only way to hear them once I’m finished. With speakers next to each other but aiming in different directions, one would expect the low frequencies that are omni directional to combine but at a certain frequency both speakers would become directional. In effect, the lows are combining and the highs are isolated. With a measurement mic on axis of one speaker but no the other, we will expect there to be excess low end. The following trace (red) shows the two speakers with and without processing (EQ). Notice the excess low end.
QSC K10 main : mon no eq
The next trace is the same information but with the green trace selected which shows better the post eq curve.
QSC K10 main : mon eq 1
Lastly, I placed the measurement mic near center of the two main speakers to see how the whole system works. In the final trace, you will notice that there is a dip between about 2kHz and 4kHz which I chose to leave alone since one would expect there to be some sort of cancellation at the seam between the two speakers.
QSC K10 quad eq
The final rehearsal leading up to the event this evening was last night and at around midnight I received the following text from the stage manager: “Sound is in good shape. The speakers sound GREAT!” This is no accident. First I had to advocate for a system design that met their expectations. Then I had to locate the speakers in the best location for their purpose and aim them to avoid reflections while optimizing coverage. Then I had to resolve the inherent low mid build up from having (4) speakers near each other via EQ. Once that was done, a “the speakers sound great” review is typical.

Color coded measurement mics

I don’t recall who told me they color code their measurement mics but it’s a great idea and one that I’ve adopted to keep track of which mic is which. For the color choice, I’ll follow the resistor color code which is a carry over from my days at SHOWCO. If you knew the resistor color code you could assemble and troubleshoot a SHOWCO sound system as all the amps, speakers and cables were color coded.
WIKI – Electronic Color Code
Resistor Color Code
Audix mics color coded
It’s important to note that these mics don’t measure the same in frequency response or sensitivity.
Here is a screen capture of all (6) measurement mics (plus a TF1) for a reference without adjusting for sensitivity differences.
Audix measurement mic no offsets
This is the same traces after I’ve manually adjust the trace offsets in an attempt to match them. Notice the difference in the high frequency range.
Audix measurement mic comparison offsets

Hyperlinks and the Uncertainty Principle

A dear friend of mine once said that hyperlinks were one of the greatest inventions of our time.
WIKI – Hyperlink

I was just reading about the law of conservation of energy
WIKI – Conservation of Energy

and clicked on the hyperlink for Uncertainty Principle
WIKI – Uncertainty Principle

Which is an aspect of the explanation of Quantum Mechanics
WIKI – Quantum Mechanics

Which deals with explaining how a wave functions.
WIKI – Wave Function

All of this is related to Fourier Transforms
WIKI – Fourier Transform

Which is the theory and math behind fast fourier transforms
WIKI – Fast Fourier Transform

Which is the basis for how we measure audio in the modern world
WIKI – Audio System Measurements

It’s amazing how so interrelated things are.

RF Venue – RF Explorer Rack Pro arrives

Today was an RF scanner party at my house. Not only did the RF Explorer Rack Pro I ordered arrive (which includes Clear Waves software license) but a short while later the SMA to BNC adapters I ordered off eBay showed up too. When I ordered the Rack Pro, I also ordered a spare antenna to try with my existing RF Explorer WSUB1G handheld unit. In order to use the Rack Pro antenna, I needed an SMA to BNC adapter.

Consequently, I was able to experiment with the RF Explorer Rack Pro / Clear Waves combination and also try out the Rack Pro antenna on my RF Explorer WSUB1G handheld tied to Vantage software. Based on my initial tests, it appears there is about a 5db sensitivity increase using the Rack Pro BNC antenna when compared with the stock Nagoya N-773 antenna that comes with an RF Explorer WSUB1G. What this means in real terms is that the provided data using the Rack Pro antenna is more accurate and shows things that don’t even register with the stock antenna. This isn’t to say that the stock antenna isn’t useful but that the Rack Pro antenna is a welcome addition to the kit.

I also ordered some BNC 50ohm termination adapters to protect my Rack Pro from overload when it’s not in use.

Why you should tune your stage monitors in the venue prior to an event

Let’s assume there is a stage full of floor wedges that are being provided by a rental company. Shy of verifying them with a measurement rig, there is no reason to assume the wedges are all functional much less able to provide a flat frequency response just because they came out of a truck. In fact the chances of them providing a flat frequency response is almost zero. Here are a few scenarios I’ve run into over the years.

1. The local has his / her favorite settings to make the monitor sound good which could mean anything.
2. No one has any opinion at all and maybe doesn’t even care. After all, “it does makes sound.”
3. You’ve been provided with a really nice monitor rig that is well maintained and the local has tuned them for you (and not with his voice).

The first time I actually made the time to measure all the stage wedges provided for my show was an eye opener. I was provided with “custom” 2 way active boxes. By measuring each box individually, I found some frightening things. In some cases the woofer & horn were out of polarity leaving a huge hole in the frequency response through out the crossover range. I also discovered extreme imbalances between woofer & horn due to the amp settings which by the way changes the crossover frequency. I also found one wedge that only produced highs because the speakon connections were loose. It was on this specific gig that I decided to purchase Smaart 7. Specifically for it’s LIVE IR function.

This might be a rare case but my guess is that any sound company that is providing “custom” active stage monitors that doesn’t own a measurement rig (and know how to use it) is providing inferior gear and service. At one time in history, all stage monitors were “custom” made. Fortunately the industry matured and we now have some very good sounding and well processed options. This isn’t to say that they don’t need to be verified and tuned. I speaker with a perfectly flat response won’t be perfectly flat anymore if it’s near a wall or near a corner of a room (a typical situation on a small club stage). If you use 2 wedges as a pair (typical), you will have severe comb filtering across most of the frequency range unless you aim those speakers correctly to avoid it. Even so, you can expect the low end of a wedge pair to be enhanced and expect to need some low end reduction in order to provide a flat frequency response to the user. Many monitor engineers use their 31 band graphic EQ to “shape” or “correct” the response of a wedge but I would strongly argue that is the wrong approach. Stage monitors should be processed for a flat frequency response (just as a sound system should be) leaving the 31 band graphic EQ flat. This allows for quick adjustment of the mix if necessary. If you use the graphic eq to shape the response of a stage monitor, you’ve already hacked things up before the artist arrives.

For years I saw band riders that said, “no passive wedges, all wedges must be active 2 way with 2″ HF driver.” In theory,

In my view, unless you’re provided with a self powered wedge, you’re better off with a well designed passive wedge than an unknown active wedge. Whether you’re designing a passive or active wedge (or any speaker for that matter) you have to select the right drivers, build a box that those drivers are happy in and then optimize how those drivers interact and work together. Get it right and you’ve got a marvelous thing. Get it wrong and no amount of EQ will solve the issues. With a passive wedge designed by a reputable company, there isn’t much to go wrong. You can damage the driver / drivers by using too many or too little watts but otherwise it will just work. Once you move into the active realm, there are a dozen or more things to go wrong. One of the mistakes I’ve seen made on active stage monitor rigs more than once is to adjust the balance between the lows and the highs using the amp channels. To be clear, there is a right and wrong way to adjust the response of an active speaker and it shouldn’t be done at the amps once the speaker has been correctly configured. How? With a measurement rig. A measurement rig will help make important decisions like the crossover frequency, balance between lows and high and the general shaping of the speaker. Once all that is done correctly, it’s a safe bet that the wedge will sound good AS IS and whatever might need to be adjusted will be easily managed with the industry standard 31 band graphic eq provided on pretty much every monitor rig in the modern world. If you get the crossover / balance between drivers and processing wrong, there is little chance the graphic eq will be able to solve the issues.

Questions:

How do you choose the appropriate cross over frequency?
How do you choose the correct amp / amps to power a passive or active speaker?
How do you process a speaker in such a way that it has a flat frequency response on the floor?

Sound Devices USBPre

The Sound Devices USBPre was an industry standard for 2 channel audio measurement purposes until the USBPre 2 came out. I’ve always been curious about both of these devices due to their quality, size and popularity and recently came across a good deal on a USBPre and thought I would try it out. The short story is that the device is well built and works if given the right circumstances. The long story is that I would not recommend a USBPre for modern measurement purposes. It’s got too many things working against it. If you already own one, it certainly has value. If nothing else as a high end headphone amp and 2 channel recording interface. Consider the following before you purchase a legacy USBPre.

1. The USBPre has unbalanced RCA outputs so in order to do a reference measurement loop and feed pink noise to a sound system you need adapters or a RCA to 1/4″ cables. The balanced 1/4″ inputs can be configured as LINE or DI inputs, neither of which is ideal for interfacing with unbalanced RCA level signals.

2. Since the USBPre is discontinued and no longer supported by Sound Devices, it will NOT work with modern 64 bit operating systems using the existing Sound Devices driver. If you have an older PC (running 32 bit XP, Vista or Window 7) or a Mac running OSX 10.6 or older, there is no reason a USBPre can’t work for audio measurement purposes. I did exactly this tonight using a MacBook 2008 running 10.6.8, SpectraFoo Complete. There are a few things you have to do to get it to work but it works. I had to create an aggregate device in the audio midi setup that includes USBPre – 2 inputs / 2 outputs. By default the USBPre inputs / outputs appear as two separate devices (2 input OR 2 outputs) in OSX.

There is a 3rd party driver that in theory will allow the USBPre to work with a 64 bit OS:
USB Audio – universal driver
There are no guarantees the driver will work for your system and I’m not sure it’s worth nearly $50 for the driver but I got the demo driver to work. It makes a beeping sound about every 30 seconds but I was able to get my USBPre configured in Smaart 7 / OSX 10.9.5.

I love the form factor of the USBPre and now will budget for purchasing a USBPre 2 in the near future. When you’re traveling, size is a factor and the USBPre 1 & 2 are about 1/3 the size of my Metric Halo and RME interfaces.

If you are in the market for a portable 2×2 audio interface for measuring purposes the Sound Devices USBPre 2 is hard to beat.

Audio Control CM10

I recently borrowed an Audio Control CM10 measurement mic to compare it with other measurement mics I own.

Audio Control CM-10

Audio Control CM10
For a sound source, I used a QSC KW122 speaker. The DUT (devices under test) are the mics. If I used the one mic and measured a batch of speakers, the speakers would be the DUT.
The comparison was between:
Audio Controls CM10
Earthworks M30BX (self powered)
Audix TM1 (current measurement mic model)
Audix TR40a (discontinued measurement mic model)

In the following image, note that the mic traces match closely in frequency response until about 4kHz and then only the CM10 begins to deviate from the other traces. This indicates that the frequency response of the CM10 above 8kHz is less accurate than the other mics. Even so, the deviation is minor. Maybe 4db off from the rest at certain frequencies.
Audio Control CM10 comparison

This next image was made using the ZOOM function in Smaart 7. I have zoomed in to the range between 5kHz and 20kHz so the CM10 deviation is more noticeable.
Audio Control CM10 comparison 5k to 20k

To simplify things, the next image is a comparison between just the CM10 and Audix TM1.
CM10 : TM1 comparison

This is a zoom between 5k and 20k of the same two microphones.
CM10 : TM1 comparison 5k to 20k

I would need to measure a sample of brand new Audio Control CM10 units to know for sure if this older CM10 mic meets the factory spec for the mic. One could certainly make relatively good decisions about system optimization using the CM10 measurement mic.

RF antenna theory

There is little point in learning about RF scanning and coordination if you don’t understand how sending and receiving antennas work. I don’t currently possess that information. I have a general idea but it’s already clear that I need a better foundation. For the last week or so since I dove head first into RF, I keep recognizing similarities between transfer functions and RF. I’m actually beginning to think that RF is much more difficult to grasp and do well. This is good news. Who would think that sound system design and optimization could be considered “easy” in comparison to another aspect of professional audio? What is becoming obvious is that there are many parallels between the two concepts. Both deal with frequency, wave length, time, constructive and destructive interference, phase, etc… Both use tools to visualize what we cannot see with our eyes. One uses and RF scanner & the other uses a measurement mic and transfer function. Different ranges of the same electromagnetic spectrum.

I won’t be surprised if learning more about RF actually answers some of the questions I still have about sound system design and optimization. One can hope.

Most of us in the live audio realm deal with RF mics and I’d be willing to be bet that many of us have only a slight understanding of how the technology actually works and how to optimize the hardware. “RF coordination and optimization”.

Properly using RF gear and coordinating your frequencies is a fairly straight forward process. Understanding sending and receiving antennas is the final frontier of optimizing RF. Get it right and your rig is artifact free. Get it wrong and your event is ruined.

The industry has a few antenna types that we need to know about if we’re going to pick the right antenna / antennas for the job.

HELICAL:
Professional Wireless Services – Helical Antenna
RF Venue – CP Beam

DIVERSITY FIN
RF Venue – Diversity Fin

LPDA (Log Periodic Dipole Array)
Lectrosonic – LPDA (Log Periodic Dipole Array)

Here is great article by Volker Schmitt & Joe Ciaudelli of Sennheiser:
prosoundweb.com – Understanding Wireless : Positioning Antennas For Trouble Free Transmission

Here is a white paper explaining how the Diversity Fin design works provided by RF Venue:
The Diversity Fin Antenna and Polarization Diversity for Wireless Microphone Applications

Here are some links to RF Venue’s Alex Milne’s blog.
RF Venue blog – Understanding the Difference and Debunking the Myths Between Active and Passive Antennas
RF Venue blog – What is ERP?
RF Venue blog – Polarization, Polarity and Polar Pattern: What’s the Difference?

RF Explorer – Arts 5th Avenue

This afternoon I stopped off at Arts 5th Avenue in Fort Worth Texas to deliver a RF hand held mic system. I had a choice of (2) Sennheiser EW100 series G2 systems. One in the A band (516mHz to 558mHz) & the other in the B band – (620mHz to 668mHz). I’ve had trouble getting the unit in the B band to work in Fort Worth but not in Dallas. Why?

INSERT TRACE HERE:

While I had the two systems side by side I noticed that the whip antenna’s for both rigs are the same maximum length. In fact, after that, I checked an old 700mHz system and it has the same whip antennas. Can the same receiving antenna (extended to the same length) be optimal for picking up 3 different frequency bands? Logic would suggest no but I don’t know enough about RF principles to know. Obviously I have a lot to learn about how antenna’s work…

A clue is given to us by Lectrosonics. Their SMA600 dipole antenna is adjustable and the length to frequency increments are etched right on the antenna.
Lectrosonics – SNA600 dipole antenna PDF
Lectrosonics SMA600

Lectrosonics SMA600 tuning instructions

The length of an antenna is it’s tuning. Knowing that, we can’t ignore the length of our antenna’s as they relate to different frequency ranges. Obviously an antenna might work to some degree regardless of it’s length (think coat hanger for a TV antenna) but that doesn’t mean that the signal is being captured optimally.

Here is a website that provides an antenna wave length calculator:
csgnetwork.com – antenna generic frequency calculator

Smaart 8 preview & Smaart class announcement for San Diego 2016

Smaart 8 logo
Just got this email from friend and Rational Acoustics instructor Harry Brill Jr.
QUOTE:
Please pass this on to anyone you think would be interested. Maybe this would work for the guys that want to get trained.
http://www.rationalacoustics.com/events/sandiego/
There are special discounts available to attendees that register for the class and purchase Smaart before class. Smaart 8 is coming out March 15 and well be at an introductory upgrade price for Smaart 7 owners. I will be able to offer additional discounts over what Rational offers directly.
http://www.rationalacoustics.com/smaart-v8-preview/
If you buy v7 (even at the class discounted rate) from now until v8 is released you will get a free upgrade to v8. After v8 is released you will get v8 when ordering a new license. It’s important to note if you are upgrading from an older version, you may be better off upgrading to v7 then later getting v8 for free, than to wait until v8 comes out, since you may be skipping a version, and that usually means paying more for the upgrade.
Harry Brill Jr.
Vice President
Tiger Audio, Inc.
proaudioguy@tigeraudioinc.com
http://www.tigeraudioinc.com
END QUOTE
Here is a direct link to the website to book the class:
http://www.tigeraudioinc.com/sandiego2016.html

RF Coordination

Most of us in the pro audio industry deal with RF (wireless mics, clearcom, assisted listening, walkie talkies, etc…) but few actually have a solid grasp of all the essential elements that make it work properly (knowledge of the hardware, understanding of the physics, antenna theory, frequency coordination, intermodulation distortion, etc…) There is nothing easy or simple about doing RF well and as the FCC sells off more and more bandwidth, our lives regarding RF are going to get more and more difficult. Might as well begin the process of preparing now.

Recently, after having some RF issues, I bought an RF scanner and the software necessary to monitor and save RF spectrum scans. Interestingly the universe is now handing me a cornucopia of RF issues to work with. This morning I received a text message from a staff member at a church that has (5) Sennheiser EW100 series A band (516mHz to 558mHz) RF mics. Via Teamviewer app, I was able to log into the local computer that records the services and see that (4) out of (5) RF receivers were being stomped on. I was also able to mute those channels so the church could get through their morning service without interruption from RF blasts. I headed to the church as soon as possible and we retuned everything to a new area of frequencies that is hopefully clear. Note that the existing frequencies were clear when I arrived but suffered so RFI (radio frequency interference) earlier in the day. Something is intermittently causing issues. No choice but to run from it.

In order to coordinate RF correctly, you need a few resources. An RF scanner is mandatory so you can scan the local RF spectrum and see if there are any openings. An RF scanner is not a panacea because it only scans when it’s active so if you scan for 5 minutes and then stop and then some RFI comes along, you won’t know it via the scanner. In addition to scanning locally, you also need to know what to expect regarding broadcast signals in the local area. In theory your RF scanner would show you the same data but sometimes the FCC data isn’t up to date in which case, if you used only their data to coordinate frequencies, you might avoid using some of the RF spectrum that is actually clear. For example, if a broadcaster becomes dormant.

Some of the information needed is readily available on the internet.
For the USA, here is a wiki article that explains the frequencies that DTV channels use.
WIKI – North American Television Frequencies
WIKI – North American Television Frequencies Broadcast Television

Once we know that X TV channel uses between Y&Z frequencies, we can understand what spectrum may be fair game for our purposes. Remember, there are no guarantees.

Here is a chart that shows which DTV channels are active in X location.
FCC DTV map

Programs like IAS, Clear Waves and RF Guru will include this information and use it when helping choose frequencies. Meaning that you can figure it all out for yourself by piecing all the data together or you can use an existing set of tools to do it for you.

Manufacturers like Sennheiser provide a website where you can check for known frequencies.

Sennheiser Frequency Finder webpage

You fill out the zip code or city and then set a few parameters and the webpage will provide you with a suggestion for where you tune your mics.

Here is the website for checking Shure gear:
Shure – wireless frequency finder website

The main problem with using the manufacturers information is that they logically only support their devices and the frequencies their devices operate on so if you have multiple brands of models of RF gear, you’re on your own to coordinate the RF system. This is where software like IAS is invaluable. IAS has gear lists so in addition to taking the data generated with an RF scanner, you can configure it so that it knows that you have X number of channels of RF mics, wireless com, etc… and it will know which device is tuneable and which ones aren’t and also the range they can tune over. Then IAS will provide you with a master list of frequencies you should try to avoid IMD and still make your rig work. IAS will also indicate if you aren’t going to be able to make your rig work as specified. $550 might seem like a lot of money until you ruin a show trying to coordinate your RF without it.

Allen & Heath GR1 rack mount mixer

I’ve been needing a 1RU rack mount mixer with a few stereo inputs and have been watching Ashly mixers on eBay but recently I saw an Allen & Heath GR1 and thought I would give it a try.

Obviously before I put it into service I want to verify that it functions correctly. The GR1 is a rather complicated device in as much as there are a lot of configuration options available via internal jumpers.

Allen & Heath GR1 Brochure short form PDF
Allen & Heath GR1 Brochure long form PDF
Allen & Heath GR1 User Guide PDF

My measurements from the various inputs to outputs show that the signal path to the L/R outputs is golden but there is something terribly wrong with the Mono output. At first I couldn’t get a useful measurement. As if I was getting self generated noise. I unplugged my measurement rig and landed the Mono output on a Whirlwind Qbox (small self powered speaker). Sure enough, white noise coming from the Mono output with no input signal on the mixer. As a reference, I tried the same setup with L & R outputs. Clean. So something is wrong with the Mono output stage. It may be due to something being configured incorrectly inside the device. It may be from being damaged.

Two small speakers, huge hall, what could possible go wrong

I took family and friends to see a show at Bass Performance Hall this afternoon. I had seen a show produced by the same company before which was one of the best shows I’ve ever seen so expectations were high. Sadly the production became more of a learning experience for how not to do sound.

The production included only (2) speakers. One on each side of the set. The speakers were both on tripod stands which tipped the speakers backward a bit. I didn’t think much about this at first but as soon as the show started it became obvious that the spectral balance of the sound system was not balanced at all.

I purposely bought seats in the center and as close to the stage as I could get so that we could see and hear well. What came out of the (2) speakers was excessively low end heavy. So much so that the prerecorded female dialogue was muddy sounding. The male dialogue was even worse and mostly unintelligible. Consequently, there were whole scenes that just didn’t work.

For me, this makes a few things very clear that need to be considered whenever designing a sound system.

1. air loss is inevitable and it tilts everything toward the low end over distance
2. inverse square law dictates that level will decrease by half with each doubling of the distance
3.To make matters worse, low frequencies are supported by room boundaries so the inverse square law only applies to direct sound that doesn’t get reflected back into the room.

So the voices were muddy sounding which made it near impossible to follow the story which made the show difficult to enjoy. Proof of this was that people left at intermission. People got up and left during the show, kids started crying, cell phones came out, etc… A missed opportunity for a show that has all the potential to be stellar.

I actually texted house crew at intermission about the situation hoping it would be resolved before Act 2 began but knowing that without a reference point, there was no way to easily resolve the situation.

Before the show started I texted with house staff whether or not the production tuned the system. The answer was no. 🙁 The logical question is “Why Not?” How is it even considered anything but mandatory to tune your system once it’s located in a acoustic environment? That is the equivalent to tuning your guitar at home and not tuning it when you get to a new location.

Let’s optimize the existing setup and also redesign the system as an exercise in who things might be made better.

OPTION 1 – AS IS and optimize as much as possible.

The existing (2) tripod mounted speakers should be aimed to cover the most seats evenly. I can’t know for sure but my gut says the speakers were aimed upward too much for the seating configuration. So aim the speakers and then equalize the system to compensate for the distance and air loss. There would have to be a balance between excessive high frequencies at the front rows and not enough at the rear seats but that would be a worthy pursuit. If in doubt, error toward less low end than more knowing that the room, air and distance is going to make things bass heavy anyway.

OPTION 2 – redesign and optimize

Anyone that been to a modern venue or concert in the last 20 years has likely noticed that the main speakers are up in the air. This design approach evens out the playing field so that those in the front seats aren’t bombarded by excess level so the sound system can reach the rear of the venue. With speakers on the stage, you can only get them so high off the deck.

So I would fly the main speakers until they provided acceptable coverage for all but the first few rows of seating. I would add front fills for those seats so the on axis point of the main speakers could be aimed further back in the venue without worry about leaving the front rows uncovered. This is a typical approach to coverage. At some point in a large venue, it’s just time to add delay speakers to make up for air loss and distance. Doing so adds intelligibility back to the rear seating areas. With the flown mains, front fills and delay speakers, it would be possible to provide even coverage to all the seats.

Interestingly, what I describe is exactly what the venue has for a house sound system. If the traveling production had used the house system, I dare say the audience would of had a much different and better experience. The moral of the story is that a system that works well for a smaller venue might be completely inadequate for a larger venue. This is probably a true statement in general. “If it works for a smaller venue, it won’t work for a larger venue.” Physic isn’t affected by budgets or shortsightedness.

So a recap.

With absolute certainty:

Your sound system WILL lose high frequencies due to air loss over distance (loss of intelligibility)

Your sound system WILL lose general level over distance (loss of intelligibility)

IF your sound system is near stage level and raised up high enough, those up close will experience excessive level in order to provide adequate level for the rear seats. The one tool for correcting this is axial loss (being off axis of the sound system) but that is not a good tool to use IF it causes excessive reflections in the room (loss of intelligibility)

At least indoors, the venue will enhance low frequencies due to boundaries but not mid and high frequencies which will tilt a sound system’s response toward the low frequency range (loss of intelligibility)

At the end of the day, intelligibility is king as far as I’m concerned. Especially when it comes to story telling. It may be acceptable to have a muffled vocal at a rock show but not for musical theater or theater. If we can’t understand the words, we can’t follow or even care about the story.

Sound Transmission Class

Im about to start a garage renovation with a goal being to sound proof part of it for recording purposes. Before I can decide on the construction design I have to decide how much sound isolation I want to achieve. STC or sound transmission class gives some helpful information regarding this matter.
WIKI – Sound Transmission Class

RF Explorer and Touchstone Pro – first use

I’ve been experimenting with my RF Explorer RF scanner and Touchstone Pro scanning software on the kitchen table to get a handle on what does what. Today I had a meeting at a church I previously designed the sound system for and out of my own curiosity too my RF scanning rig. The church’s RF gear consists of (5) Sennheiser EW100 beltpack transmitters / receivers with the stock antennas. When the gear was installed about 5 years ago, I used the receivers onboard scan function to select frequencies. Recently I was told that there has been some sort of noise / static. Having asked the logical questions to narrow the hunt down, it appears that the issues happen when some or all of the people wearing transmitters go to the far end of the building to greet the congregation. That part of the building is a separate structure with mostly stone between the receivers. There are some stained glass windows. After setting up my RF scanner rig and beginning to scan, I noticed that (2) of the frequencies in use were very near some peaks shown in Touchstone Pro. This is exactly why having a RF scanner & software is necessary. When the Sennheiser unit performs it’s scan it last about 2 minutes. There is no information given about what it finds during the scan, at what level any interfering signals are. It just says, “X frequencies clear…” Knowing what I know now, scanning for 2 minutes is a poor indication of what might happen 2 minutes or 2 hours or 2 days later. In my view the most important function a RF scanner rig can play is to collect an RF history at a certain location. A 2 minute scan could easily miss all sorts of things.

So I retuned (2) of the (5) units and then sync-ed the transmitters to the receivers. Then I tested both mics and then took one for a long walk while my friend watched the RF level indicator on the Sennheiser receiver. He said that the level did drop a bit when I went to the other part of the building but not completely out.

Touchstone Pro can export CSV files in various formats to be imported into Intermodulation coordination software like IAS, Shure’s WWB & . I saved my results in two different formats and packed up.

Audix TM1 / TR40a / TR40 comparison & microphone calibration

Having recently acquired a used Audix TM1, I was curious to see how it compared to it’s predecessor, the Audix TR40a and it’s predecessor the Audix TR40. As a sound source, I used a Genelec 1029a self powered speaker.

Genelec 1029a frequency response
Genelec 1029a off axis response

The following information gives us a baseline of what to expect when we measure.
Genelec 1029p specs

genelec.com – 1029a data sheet PDF

Keeping that in mind, the first measurements I made were of my Earthworks TC40K matched pair and the Audix TM1.
Audix TM1 & Earthworks TC40K Matched pair
Note the TM1 closely matches the TC40K matched pair. Note where the phase rotates around 3.3 kHz. Note how the low frequency response begins to roll off around 70hz and the high frequency response begins to roll off around 20 kHz. All supported by the specs Genelec provides.

Having verified the TM1 against two Earthworks TC40K mics and satisfied with those tests, I can trust the TM1 for measurement purposes and use it as a reference point for all the other Audix mics in my kit. (3) Audix TR40, (1) Audix TR40a, (1) Audio TM1.

Audix all with offsets

Notice that the pink trace rises up a bit between 4k and 16k. Notice that one of the TR40 (yellow trace) rises up between 4k and 16k even more. The rest of the mics are pretty close in frequency response. It would appear that (5) Audix mics – (3) different models from (3) different eras all match pretty well. True and false? Something that isn’t revealed by the data presented so far is that the sensitivity of the different models of mics don’t match. I had to setup offsets to make them match each other. So it’s true that the mics roughly match in frequency response but it’s false that they match in sensitivity.

Without adding the offsets to the rig, the same measurement results would look like this:
Audix all without offsets

The following offsets were necessary to match the mics in level.
Audix TR40-1 = -9db
Audix TR40-2 = -9db
Audix TR40-3 = -9db
Audix TR40a = -4db
Audix TM1 = 0db (no offset)

The difference between each mic relates to it’s sensitivity and we need to pay close attention to this detail if we are to calibrate our rig and get useful information when using multiple mics. Calibrating your rig is the equivalent of making all the mics match each other in both frequency response and level. It’s tempting but we can’t assume that mics from the same manufacturer and model will match in sensitivity or frequency response. You get what you pay for and one of the things you get with higher quality mics is consistency. I’ve heard horror stories about certain brands of measurement mics and how different the mics are from mic to mic, batch to batch and over time.

Bob McCarthy makes it clear in his workshops that microphone calibration is mandatory when using multiple mics. Even if yesterday the mics all measured fine, one or more may of been damaged and without verification you would be making decisions based on false information. Considering the vast majority of the optimization process involves setting accurate levels between different speakers using different mics for reference, doing so with mics that aren’t calibrated to match in level would be rather fruitless.

Meyer Sound’s SIM3 user guide provides the following information related to this topic:
Meyer Sound SIM3 Calibration Microphone 1
Meyer Sound SIM3 Calibration Microphone 2
Meyer Sound SIM3 Calibration Microphone 3
Meyer Sound – SIM3 user guide PDF

The last statement Meyer makes is worth repeating.
QUOTE:
“Once the channel has been calibrated with a specific measurement microphone, that microphone needs to be connected to that channel in order to perform the most accurate SPL measurements.”
END QUOTE:

The TM1 sensitivity spec provided by Audix via their spec sheet = 6mV / Pa @ 1k
audixusa.com – TM1 specs PDF

The TR40a sensitivity spec provided by Audix via their spec sheet = 17.9 mV / Pa @ 1k
Interestingly, the spec sheet I found for a TR40a isn’t available on Audix’s website and it disagrees with the official Audix archive page which states 12mV / Pa
audixusa.com – TR40a info

The TR40 sensitivity spec is not available from Audix but I found spec sheet PDF here:
Audix TR40 spec sheet PDF

Summary:
TM1 = 6mV / Pa @ 1k
TR40a = 12 mV / Pa OR 17.9 mV / Pa (depending on whether you trust the Audix website or the TR40a spec sheet PDF)
TR40 = 14 mV / Pa

Regarding microphone sensitivity, here is an article called “Understanding Microphone Sensitivity” by Jerad Lewis of Analog Devices.
analog.com – Understanding Microphone Sensitivity
Here is the PDF version:
analog.com – Understanding Microphone Sensitivity PDF

What I am going to do next is go through the SPL calibration process in Smaart and see how all that goes. Hopefully I can verify one way or another what Audix has to say. More soon.

Audix TM1 – craigslist

I have a habit of checking Craigslist for used measurement mics and honestly, have never seen a listing but a few days ago I came across a used Audix TM1. The listing was for $100. Since the mic sells new without the calibration chart for $299, I thought it was worth checking into. After all, I’m not always interested in putting my matched set of Earthworks mics out for basic measurement purposes due to the risk involved.

Yesterday I met the owner, exchanged $100 and brought the mic home. In an ideal world, when purchasing a used measurement mic, you would measure the mic against a known mic before making the purchase. In this case I met the guy in a parking lot. Not a lot of options for an A/B comparison but if we’d met at a church or something I might of gone to the effort of verifying the mic before I bought it. The mic did appear to be in good share and the seller was knowledgeable of the measurement concepts and was a previous Smaart user so based on the sale price, I bought it and took the risk.

For any used measurement mic purchase, I recommend carefully inspection of the mic for signs that it might of been dropped or any deformity to the tip. A mic with a bent tip or one showing signs of damage may be totally compromised but still produce sound. Even a small dent in the windscreen can affect the accuracy of a mic. Buyer beware. The only way to know for sure is to measure a known mic and then the unknown mic and compare the two. Since I didn’t do this procedure before I bought it, I’m going to do it now.

RF explorer – first day

Do yourself a big favor and order a USB A to mini-B cable either when you purchase your RF Explorer or soon afterward. Without it, you can’t use the unit with scanning software apps or even charge it. Sorta like getting an RC car for Christmas but no batteries.

After sourcing the correct cable this morning, I downloaded the USB driver for the unit, loaded it on to my PC and rebooted as instructed. I then plugged the unit in to my PC and the device was immediately recognized and the driver loaded successfully.

The various files needed to install can be found here:

j3.rfexplorer.com – downloads
rfexplorer.com – downloads
Touchstone & Touchstone Pro – downloads
While not an official release from nutsaboutnets, there is a Mac scanner app for the RF Explorer.
Irfexplorer app for Mac

Not to get ahead of myself, I installed the free Touchstone scanner app. When I ran it the first time it said I needed to install Microsoft’s NET Framework 4. I found the offline installer for the current version and now Touchstone is working.

MS NET Framework 4.5.2 offline installer

I did have to reboot after installing the NET Framework software before Touchstone would connect with the RF Explorer.

Now that I have a working system, what do I do with it?

This is where having a friend who is years ahead of me comes in handy. He has already explained how to configure things and what software he uses and why. Those details to come…

One point of interest worth mentioning:

The RF Explorer unit comes with a Nagoya Telescoping NA-773 antenna. Logic suggests that an antenna must be adjusted in length to optimize it for a certain frequency range. This is what the RF Explorer manual has to say:

QUOTE:

This is a telescopic, high quality 2dBi antenna ideally suited for 144MHz and 430MHz bands, typically used in two way radios and HAM bands.

It offers a good response in all frequencies below 1GHz. Use this antenna in all ranges of frequencies between 15-1000MHz. In some cases collapsing partially or totally may provide better response in the highest frequencies of the range.

The metallic structure of the antenna is a direct connection to the core RF connection, therefore take precautions for the antenna not being in contact with strong electric fields or DC current.

This antenna is included in RF Explorer WSUB1G, RF Explorer 3G Combo and RF Explorer ISM Combo.

END QUOTE:

So indeed for the frequencies most used for RF mics in the US, the antenna full extended is not tuned well for the purpose. How does one tune an antenna for properly receiving radio signals?

This is what SHURE has to say about antenna lengths:

SHURE – Antenna setup PDF

QUOTE:

The size of a 1/4-wave antenna is approximately
one-quarter of the wavelength of the desired frequency,
and the 1/2-wave is one-half the wavelength. Wavelength
for radio signals can be calculated by dividing the speed of
light by frequency (see “The Wave Equation”). For example,
a 200 MHz wave has a wavelength of approximately 6 feet
(2 m). Therefore, a 1/2-wave receiver antenna would be
about 3 feet (1 m) long, and a 1/4-wave antenna would be
about 18 inches (45 cm). Note that antenna length
typically needs to only be approximate, not exact. For VHF
applications, an antenna anywhere from 14-18 inches
(35-45 cm) is perfectly appropriate as a 1/4-wave
antenna. Since the UHF band covers a much larger range
of frequencies than VHF, 1/4-wave antennas can range
anywhere from 3 to 6 inches (7-15 cm) in length, so using
the proper length antenna is somewhat more important.
For a system operating at 500 MHz, a 1/4-wave antenna
should be about 6 inches (15 cm). Using an antenna
tuned for an 800 MHz system (about 3 inches, 7 cm,
in length) in the same situation would result in less than
optimum pickup. Wideband omnidirectional antennas
that cover almost the entire UHF band are also available
for applications where receivers with different tuning
ranges need to share a common antenna.

END QUOTE:

Antenna length formula

RF Explorer – RF scanner arrives

Today is a big day here at audiomeasurments.com

The RF Explorer WSUB1G 240mhz to 960mhz scanner arrived today. I’m not sure why it took me so long to bite the bullet and purchase an RF scanner considering how much RF work I do and how important it is that it work! A sort of parallel to knowing I needed a audio measurement rig and the skills to use it but waiting anyway. I guess the biggest stumbling block to getting a RF scanning rig was the price. The TTI PSA1301T RF scanner recommended to me by Professional Wireless Services when I first checked was around $2000. The model has been discontinued but here it is for reference.
TTI PSA1301T – 1.3 Ghz RF Spectrum Analyser webpage
It appears the newer version is the PSA3605 and PSA6005 units the cost between $2000 and $3000.
TTI PSA series 5 RF Spectrum Analyzers webpage
Here is the spec sheet for the current devices:
TTI PSA series 5 – spec sheet PDF

Once you have a scanner you also need software to coordinate the data.

The industry standard is Professional Wireless Systems “IAS” (Intermodulation Analysis System) software. $250 for the Basic Edition and $550 for the Professional Edition:
Intermodulation Analysis System – webpage
IAS purchase webpage

One of the hangups with purchasing an RF scanner rig or even an audio measurement rig has been the fact that my clients aren’t going to be interested (in general) with paying extra for this sort of service. Meaning that I can’t just tag on an extra $25 an hour because I have the needed tools. Consequently, having an audio measurement rig & RF scanner rig is an investment in your own production value which may not earn you a dime but may save your reputation. It will certainly make it easier to have solid RF on a show and a better sounding PA system. I’d argue both of those are a “requirement” of the gig. Easy to say now that I’m in the club on both fronts.

The decision to purchase an RF scanner and RF coordination software package was made after a recent show where of the two RF mics used on a show, one of them was taking RF hits. I decided at intermission, “Order RF scanner on Monday…” “I will never do another production that uses RF without a scanner…” The rest is history.

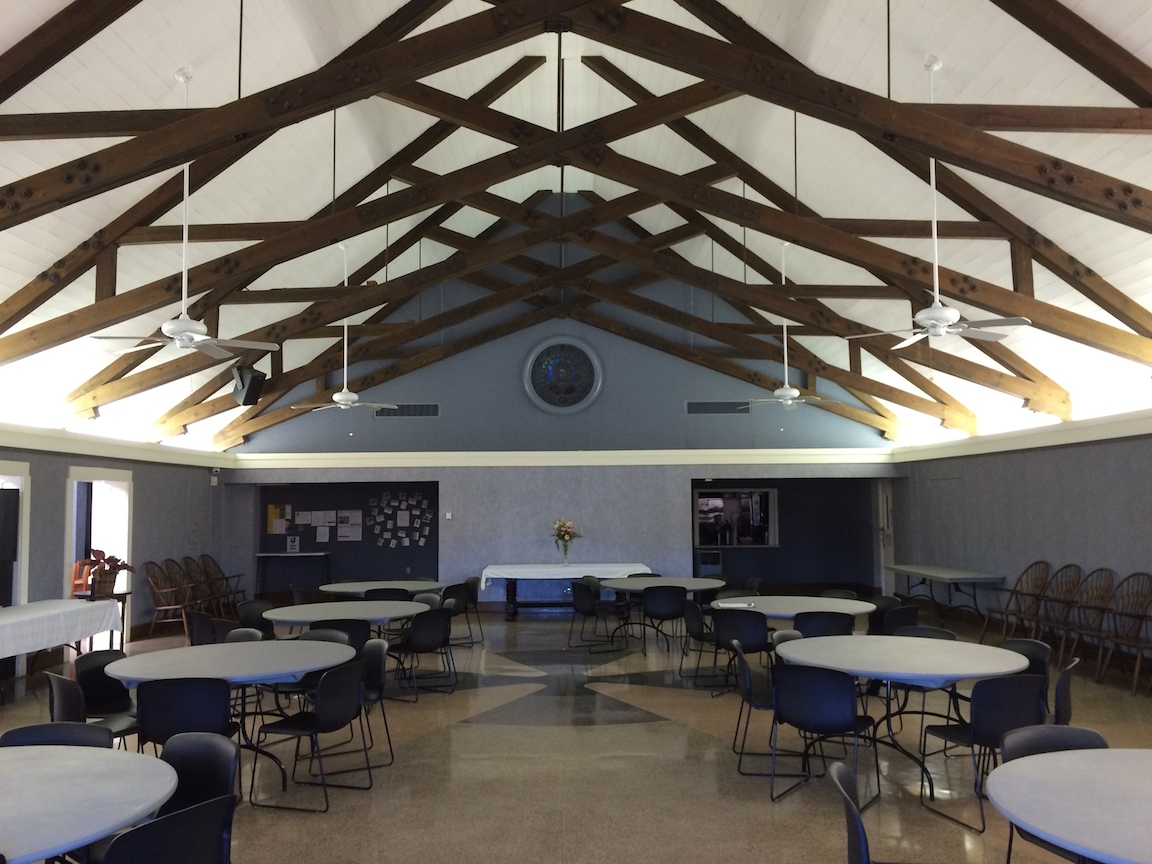
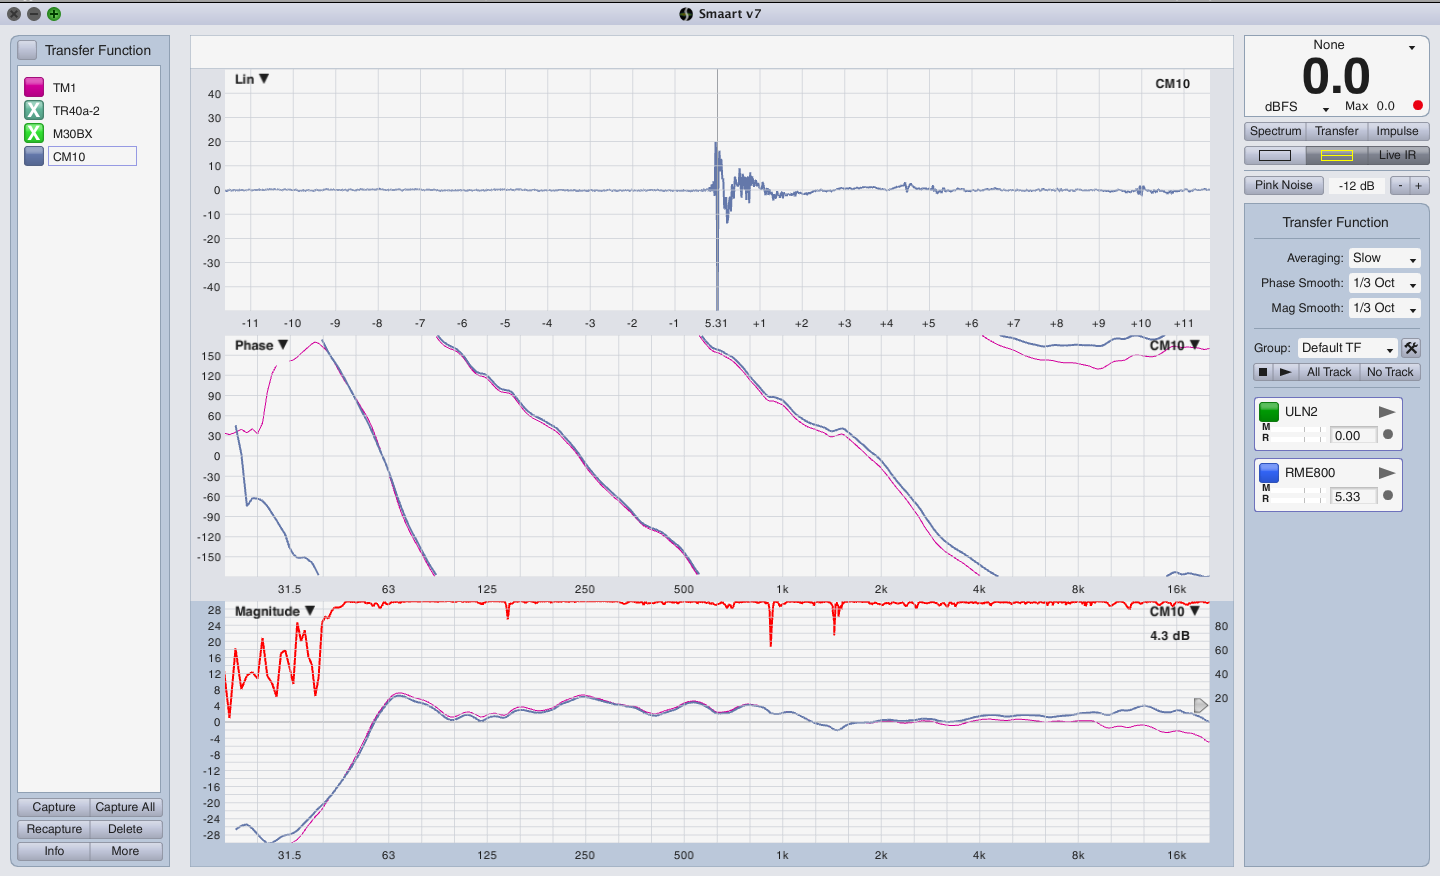
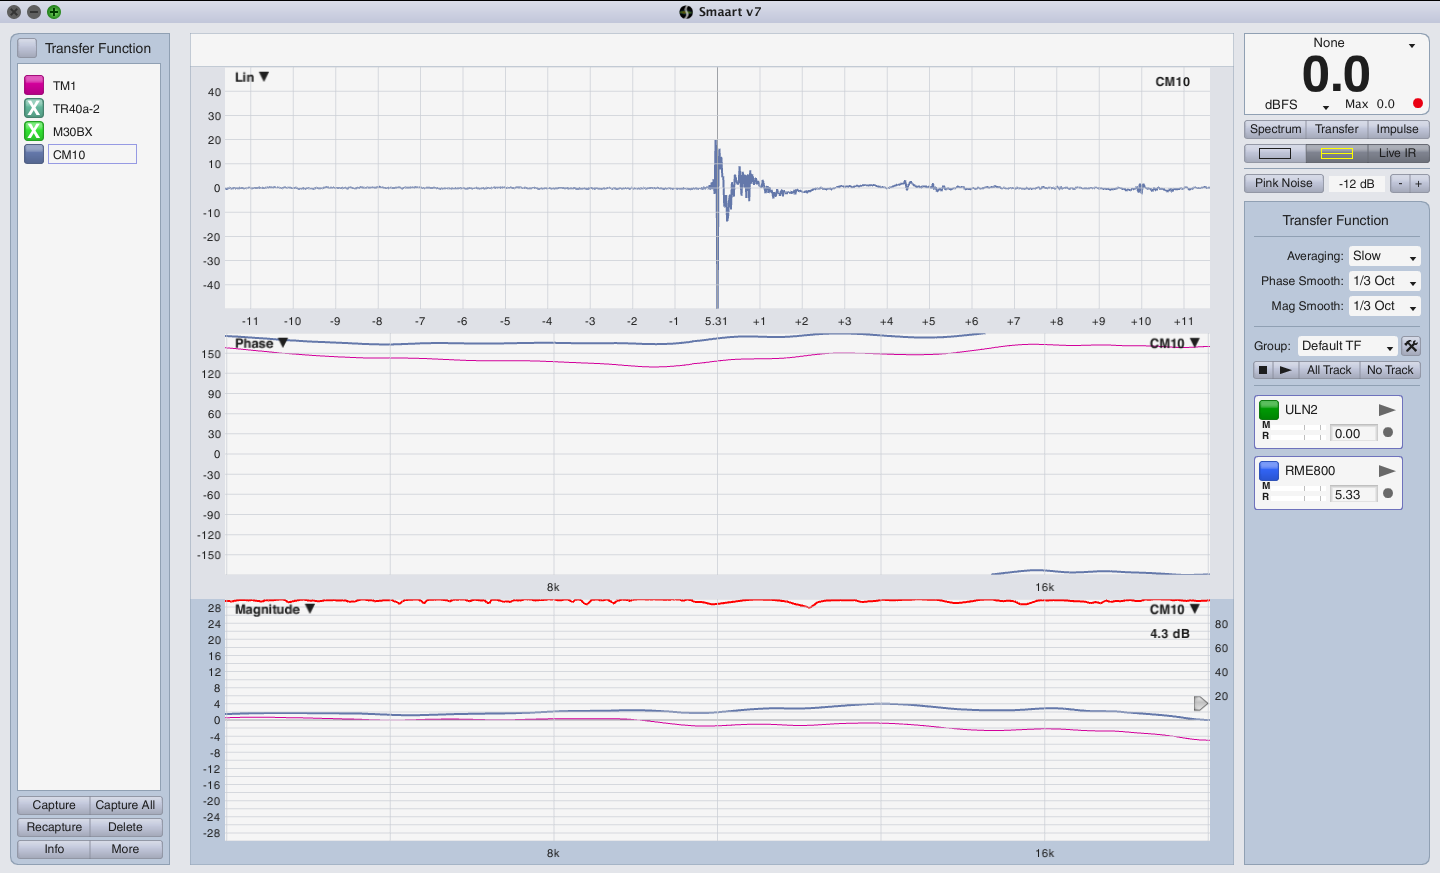
Fortunately one of my favorite Smaart 7 measurement engineers who also has an RF scanner rig brought his RF Explorer rig into the theater I was working in to do a preproduction RF scan of the venue for an upcoming show.

He uses an RF Explorer WSUB1G unit.

http://rfexplorer.com/

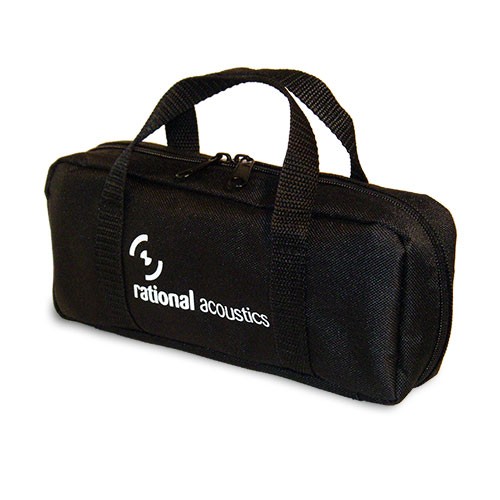
For less than $150 to get into one (after shipping and ordering the USB cable you need to charge it and transfer RF data, I couldn’t stall any longer. My unit arrived today.

A few notes to share for those who might follow my lead.

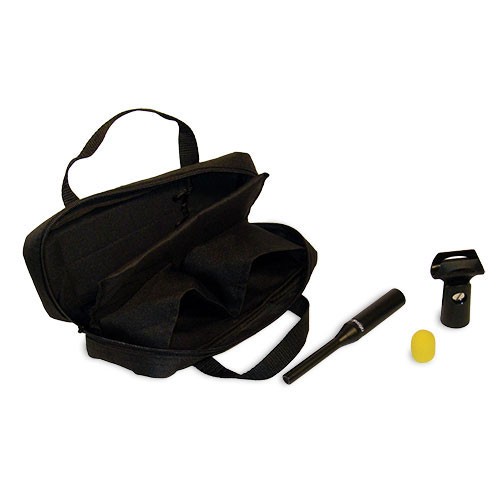
The RF Explorer scanner comes in a few different models. The base unit is the WSUB1G which can scan between 240mhz and 960mhz.

An RF Explorer without an external computer running software has limited appeal. Fortunately there are a number of options that support the device.

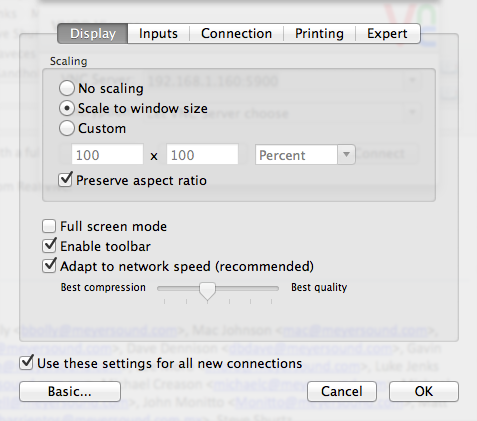
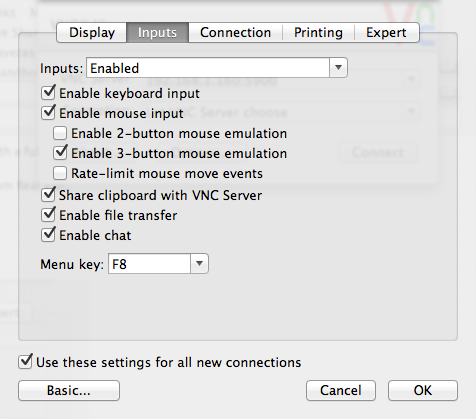
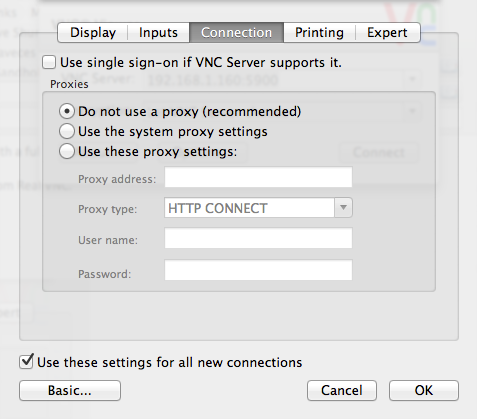
These are scanning apps that will work with an RF Explorer unit. Unfortunately there are limited options for Mac OSX users but there one now:

RF Venue “Vantage” – website

The rest of these apps are all PC only:

First up, the offerings from nutsaboutnets in order of cost and functionality.

A free app is available for the RF Explorer unit called Touchstone:

nutsaboutnets “Touchstone” RF Spectrum Analyzer Software – webpage

Note that there is a PRO version that add some extra features for $49.

nutsaboutnets also offers “Clear Waves” which is the only spectrum and intermodulation analysis app I am aware of. I’ve seen a touring Broadway production come through using Clear Waves to coordinate RF.

nutsaboutnets “Clear Waves” – website

Then there is Stage Research’s “RFscanner” app which is a companion to their “RFguru” intermodulation app.

Stage Research “RFscanner” – webpage

Stage Research “RFguru” – webpage

Last but certainly not least is Professional Wireless Services “IAS” (Intermodulation Analysis System). I’m fairly certain that this one is king of the hill when it comes to RF coordination.

“IAS” – webpage

If there are others I’ll add them to this page as I learn of them.

In the meantime, a special note regarding RF scanners.

WARNING!!!

An RF Explorer RF scanner is designed to measure incredibly low level signals. Consequently, it’s a very sensitive device. It is possible to overload the input circuitry and blow the thing up. Even when it’s not actually powered up, it’s still susceptible to this!!! One of the reasons I bought the least expensive model (WSUB11G) is because it’s a bit more robust than some of the combo models when it comes to this matter. Here is a webpage with that explains how to treat an RF Explorer so that the chance of being damaged is minimized.

RF Explorer – protecting your instrument

The antenna connector on the RF Explorer is an SMA type.
WIKI – SMA connector

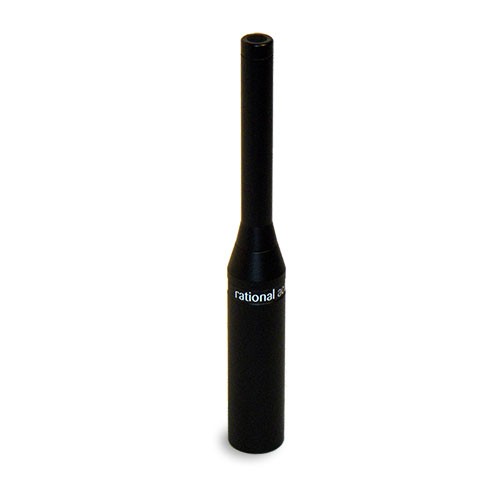
The antenna that comes with the RF Explorer WSUB1G device is a Nayogo N-773. I’ve read some bad things about this antenna.

ham radio blog – best and worst from Chinese origin

“The worst antenna ever: Nagoya NA-773.

It looks like a brilliant idea: combining a loading coil at the base with a telescopic antenna. Unfortunately this antenna is the most dangerous one on earth. Whatever the length, the SWR stays close to 1:3.0. In essence 25% of the output power bounces back into the electronics, and this amount of reflected energy is not something most PA modules can handle for a very long time. To make matters worse, reception also suffers. The gain (cough cough) of this antenna is estimated to be equal to, or worse than minus 6dBd. In other words: deaf as a post. This would make a fine present for someone you hate to the core. Total number of copies tested: three.”

Zobel network / Boucherot cell

I spent the evening watching a custom loudspeaker being built at Toby Speakers which included some of the beginning work on the crossover network.

tobyspeakers.com

In the process, the term “Zobel filter” came up and after reading about it, I realized what important the concept actually is to speaker design. I’m surprised I’ve never come across it before.

WIKI – Zobel network

QUOTE:

Zobel networks are a type of filter section based on the image-impedance design principle. They are named after Otto Zobel of Bell Labs, who published a much-referenced paper on image filters in 1923.[1] The distinguishing feature of Zobel networks is that the input impedance is fixed in the design independently of the transfer function. This characteristic is achieved at the expense of a much higher component count compared to other types of filter sections. The impedance would normally be specified to be constant and purely resistive. For this reason, they are also known as constant resistance networks. However, any impedance achievable with discrete components is possible.

END QUOTE:

Another name for the circuit is a Boucherot cell

WIKI – Boucherot cell

Boucherot cell circuit

QUOTE:

A Boucherot cell (or Zobel network) is an electronic filter, used in audio amplifiers to damp high frequency oscillations that might occur in the absence of loads at high frequencies. Named after Paul Boucherot a Boucherot cell typically consists of a resistor and capacitor in series, that is usually placed across a load, for stability.

It is commonly seen in analog power amplifiers at the output of the driver stage, just before the output inductor. The speaker coil inductance of a loudspeaker generates a rising impedance which is worsened by the output inductor generally found in analog power amplifiers; the cell is used to limit this impedance.

The documentation for some power operation amplifiers suggests the use of a “Boucherot cell between outputs and ground or across the load”.

Additionally, Boucherot cells are sometimes used across the bass driver (and mid-range) of a speaker system, in order to maintain a more constant driving point impedance as “seen” by a passive crossover. In this specific arrangement, the Boucherot cell is sometimes also known as a Zobel network.

Some loudspeaker crossover designs aim to stabilize impedance at high frequencies by including Zobel networks.

Electromagnetic Spectrum

I’ve been doing some research into RF based audio measurements and what immediately becomes apparent is that using RF based mics for anything is infinitely more complicated than using a cable. Even so there are times when RF based measurements are necessary due to time / distance / etc…

The term “radio frequency” is a man made term and it’s important to keep in mind that prior the the 1860s the only frequencies considered were visible waves.

WIKI – Electromagnetic spectrum

It’s helpful to look at the entire electromagnetic spectrum to understand where both audio frequencies and radio frequencies land. It’s also obvious that what we consider low and high frequencies in the audio world does not relate to the scale of electromagnetic frequencies.

0hz is equal to no frequency. 1hz is obviously a low frequency but is considered ELF (extremely low frequency). The same is true up to 30hz. 30hz to 300hz is considered SLF (super low frequency). 300hz to 3khz is considered ULF (ultra low frequency). 3khz to 30khz is considered VLF (very low frequency). 30khz to 300 khz is considered LF (low frequency). 300khz to 3mhz is considered MF (medium frequency). 3mhz to 30mhz is considered HF (high frequency). Yikes!!!

Obviously our scale and how we perceived frequencies is not in alignment the scale of the electromagnetic spectrum.

Relating to RF mics, we are familiar with the terms VHF and UHF but maybe not clear on what those ranges are in the context of the electromagnetic spectrum.

VHF = 30mhz to 300mhz
UHF = 300mhz to 3ghz (the range where most RF mics currently available are tuned to)

Moving up in the electromagnetic spectrum and skipping over microwaves which are next after radio waves, we eventually get into the visible radiation spectrum which covers a tiny sliver of the electromagnetic spectrum between 400 and 790 terahertz. Infrared (IR) landing between 300ghz and 400 terahertz and ultraviolet radiation (UV).

Staying on topic, for live acoustic measurements our interested in a the ELF to VLF region of the electromagnetic spectrum. One could even argue that what we’re most interested in when measuring live audio is the SLF (super low frequency) region starting at 30hz and going only partially upward into the VLF (very low frequency) range of around 15khz.

How to collect that data over the radio waves? I’ve spent the last few years looking into how to do that accurately and there are two things to share.

1. The list of tools is growing
2. The existing tools are relatively expensive

Compare a 100′ XLR cable to a Lectrosonics TM400 wireless measurement kit and the difference is startling.

100′ XLR = $25 to $75
TM400 kit = $2000

So why would someone spend $2000 on a wireless measurement rig when they can spend less than $100 on an XLR cable. One word. “TIME”! A typical procedure I’ve witnessed where a single mic gets moved around a venue to optimize each system / sub system might require hours to complete using an XLR cable. With a wireless measurement rig? Maybe 30 minutes to an hour. Maybe less.

As the available RF spectrum shrinks, manufacturers of pro audio wireless gear are forced to make changes to their products. The change that made RF measurement possible was a system that didn’t use a compander circuit which makes measuring audio with standard wireless gear inaccurate. Lectrosonics Digital Hybrid system was the first system I am aware of to allow for wireless measurements in the UHF range. If there were others first, please let me know. Next was Line 6’s 2.4ghz based X series which aren’t specifically designed for working with a measurement mic but have been adapted for that purpose by some. Most recently I learned that any of the 100% digital RF systems sold by Zaxcom in the UHF range are capable of accurately transmitting the desired data between transmitter and receiver. If the available RF spectrum continues to shrink, we may witness all pro audio wireless manufacturers moving in the 100% digital direction which may bring the cost of RF based measurement down. In the meantime, if you want an off the shelve solution that you can plug your existing measurement mic into, your options are limited.